Perfetto入门
Perfetto 入门
Perfetto 概述
Perfetto 是 Google 从 Android10 开始引入的一个全新的平台级跟踪分析工具。适用于 Android、Linux 和 Chrome 的更加通用和复杂的用于性能检测和跟踪分析的生产级开源项目。在 Android 系统中对性能分析是尤为重要的一部分,仅从 Logcat 中进行时间分解太繁琐,Android 系统中可以通过 trace 来分析性能。
- 使用
ftrace收集内核信息;ftrace:是一个内核函数跟踪器,function tracer,旨在帮助开发人员和系统设计者可以找到内核内部发生的事情。 - 使用
atrace收集服务和应用中的用户空间注释;Android tracer,使用 ftrace 来跟踪 Android 上层的函数调用。为数据采集部分 - 使用
heapprofd收集服务和应用的本地内存使用情况信息
Perfetto 提供了用于记录系统级和应用级活动的服务和库、低开销的 native+java 内存分析工具,可供 SQL 分析跟踪文件的库,以及一个基于 Web 用于将追踪文件可视化方便分析的 Perfetto UI。相比 systrace 的优势:
- 其可记录任意长度的跟踪记录并导出到文件系统中.
- 更合理的可视化分析标记功能.
- 内建 SQLite 数据库, SQL 查询的支持, 数据后期处理非常灵活.
Perfetto 是很好的性能分析工具,发展很快。它不仅可以看 systrace,也可以将 logcat 也一起提取出来,方便与其他信息放在同一个时间轴上去分析。它也可以分析 memory 问题,如 ion 和 dma_buf 泄露。
Perfetto 整体
Perfetto 是 Google 开源的一套性能检测和分析框架。按照功能可分成 3 大块,Record traces(采集)、Analyze traces(分析)、Visualize traces(可视化)。
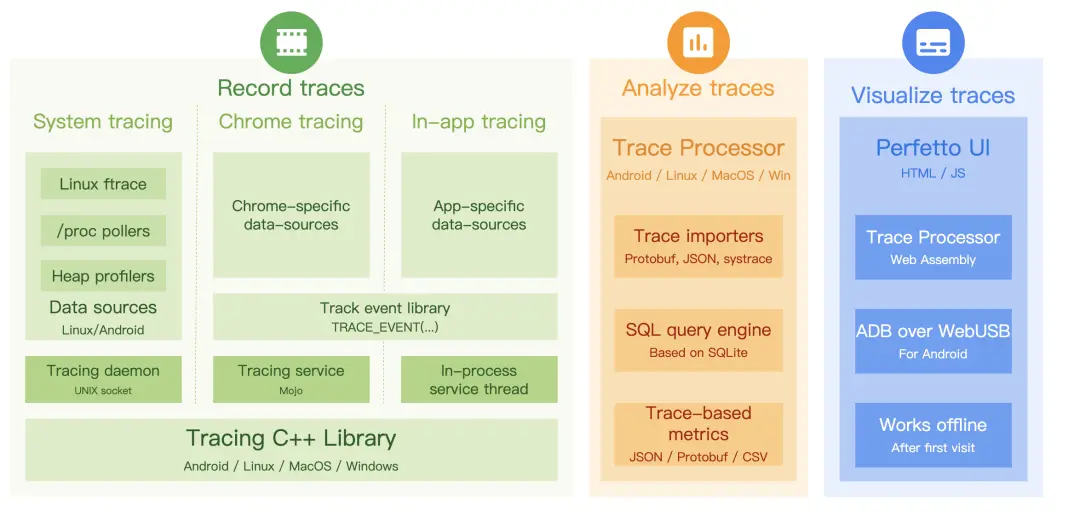
Record traces
Trace 采集能力,支持采集多种类型的数据源,支持内核空间和用户空间数据源。
内核空间数据源是 Perfetto 内置的,需要系统权限,主要的数据源包括:
- Linux ftrace:支持收集内核事件,如 cpu 调度事件和系统调用等;
- /proc 和/sys pollers:支持采样进程或者系统维度 cpu 和内存状态;
- heap profilers:支持采集 java 和 native 内存信息;
用户空间数据采集,Perfetto 提供了统一的 Tracing C++ 库,支持用户空间数据性能数据收集,也可用 atrace 在用户层添加 Trace 收集代码采集用户空间 Trace。
Analyze traces
Trace 分析能力,提供 Trace Processor 模块可以把支持的 Trace 文件解析成一个内存数据库,数据库实现基于 SQLite,提供 SQL 查询功能,同时提供了 python API,可基于 Trace Processor 开发了一套 Trace 自动化分析工具集。
Visualize traces
Perfetto 还提供了一个全新的 Trace 可视化工具,工具是一个网站:https://ui.perfetto.dev/ 。在可视化工具中可导入 Trace 文件,并且可使用 Trace Processor 和 SQLite 的查询和分析能力。
Trace Processor
Perfetto 提供了强大的 Trace 分析模块:Trace Processor,把多种类型的日志文件(Android systrace、Perfetto、linux ftrace)通过解析、提取其中的数据,结构化为 SQLite 数据库,并且提供基于 SQL 查询的 python API,可通过 python 实现自动化分析。
为提高效率,需基于 Trace Processor 的 python API,开发一套 Trace 自动分析工具集,实现快速高效分析版本启动劣化问题。
Perfetto 使用
命令行
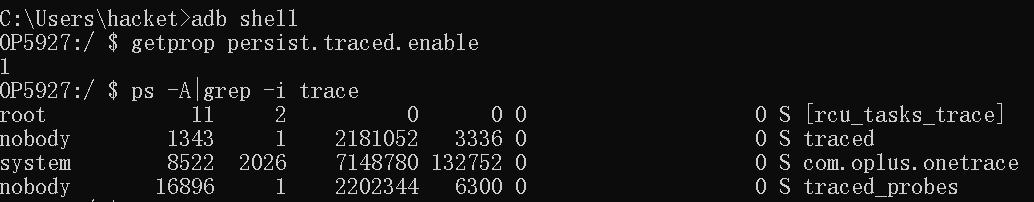
开启 traced 权限
# 设置 traced 权限
adb shell setprop persist.traced.enable 1

# 验证是否开启了traced 权限
adb shell
getprop persist.traced.enable
ps -A|grep -i trace
perfettor 格式
adb shell perfetto [ --time TIMESPEC ] [ --buffer SIZE ] [ --size SIZE ]
    [ ATRACE_CAT | FTRACE_GROUP/FTRACE_NAME]...
Perfetto 使用步骤
1、输入命令
adb shell perfetto -o /data/misc/perfetto-traces/trace_file.perfetto-trace -t 10s sched freq idle am wm gfx view binder_driver hal dalvik camera input res memory

其中:
-o /data/misc/perfetto-traces/trace_file.perfetto-trace 意思就是说将trace保存到手机的/data/misc/perfetto-traces/路径下,且文件名为trace_file.perfetto-trace-t 10s意思就是抓取 10 秒
2、将 trace 拷贝到电脑:
adb pull /data/misc/perfetto-traces/trace_file.perfetto-trace .
3、浏览器打开:Perfetto UI
4、通过 Perfetto UI 打开 trace
5、分析 trace
Perfetto UI
Perfetto 录制设置
Perfetto UI 录制界面
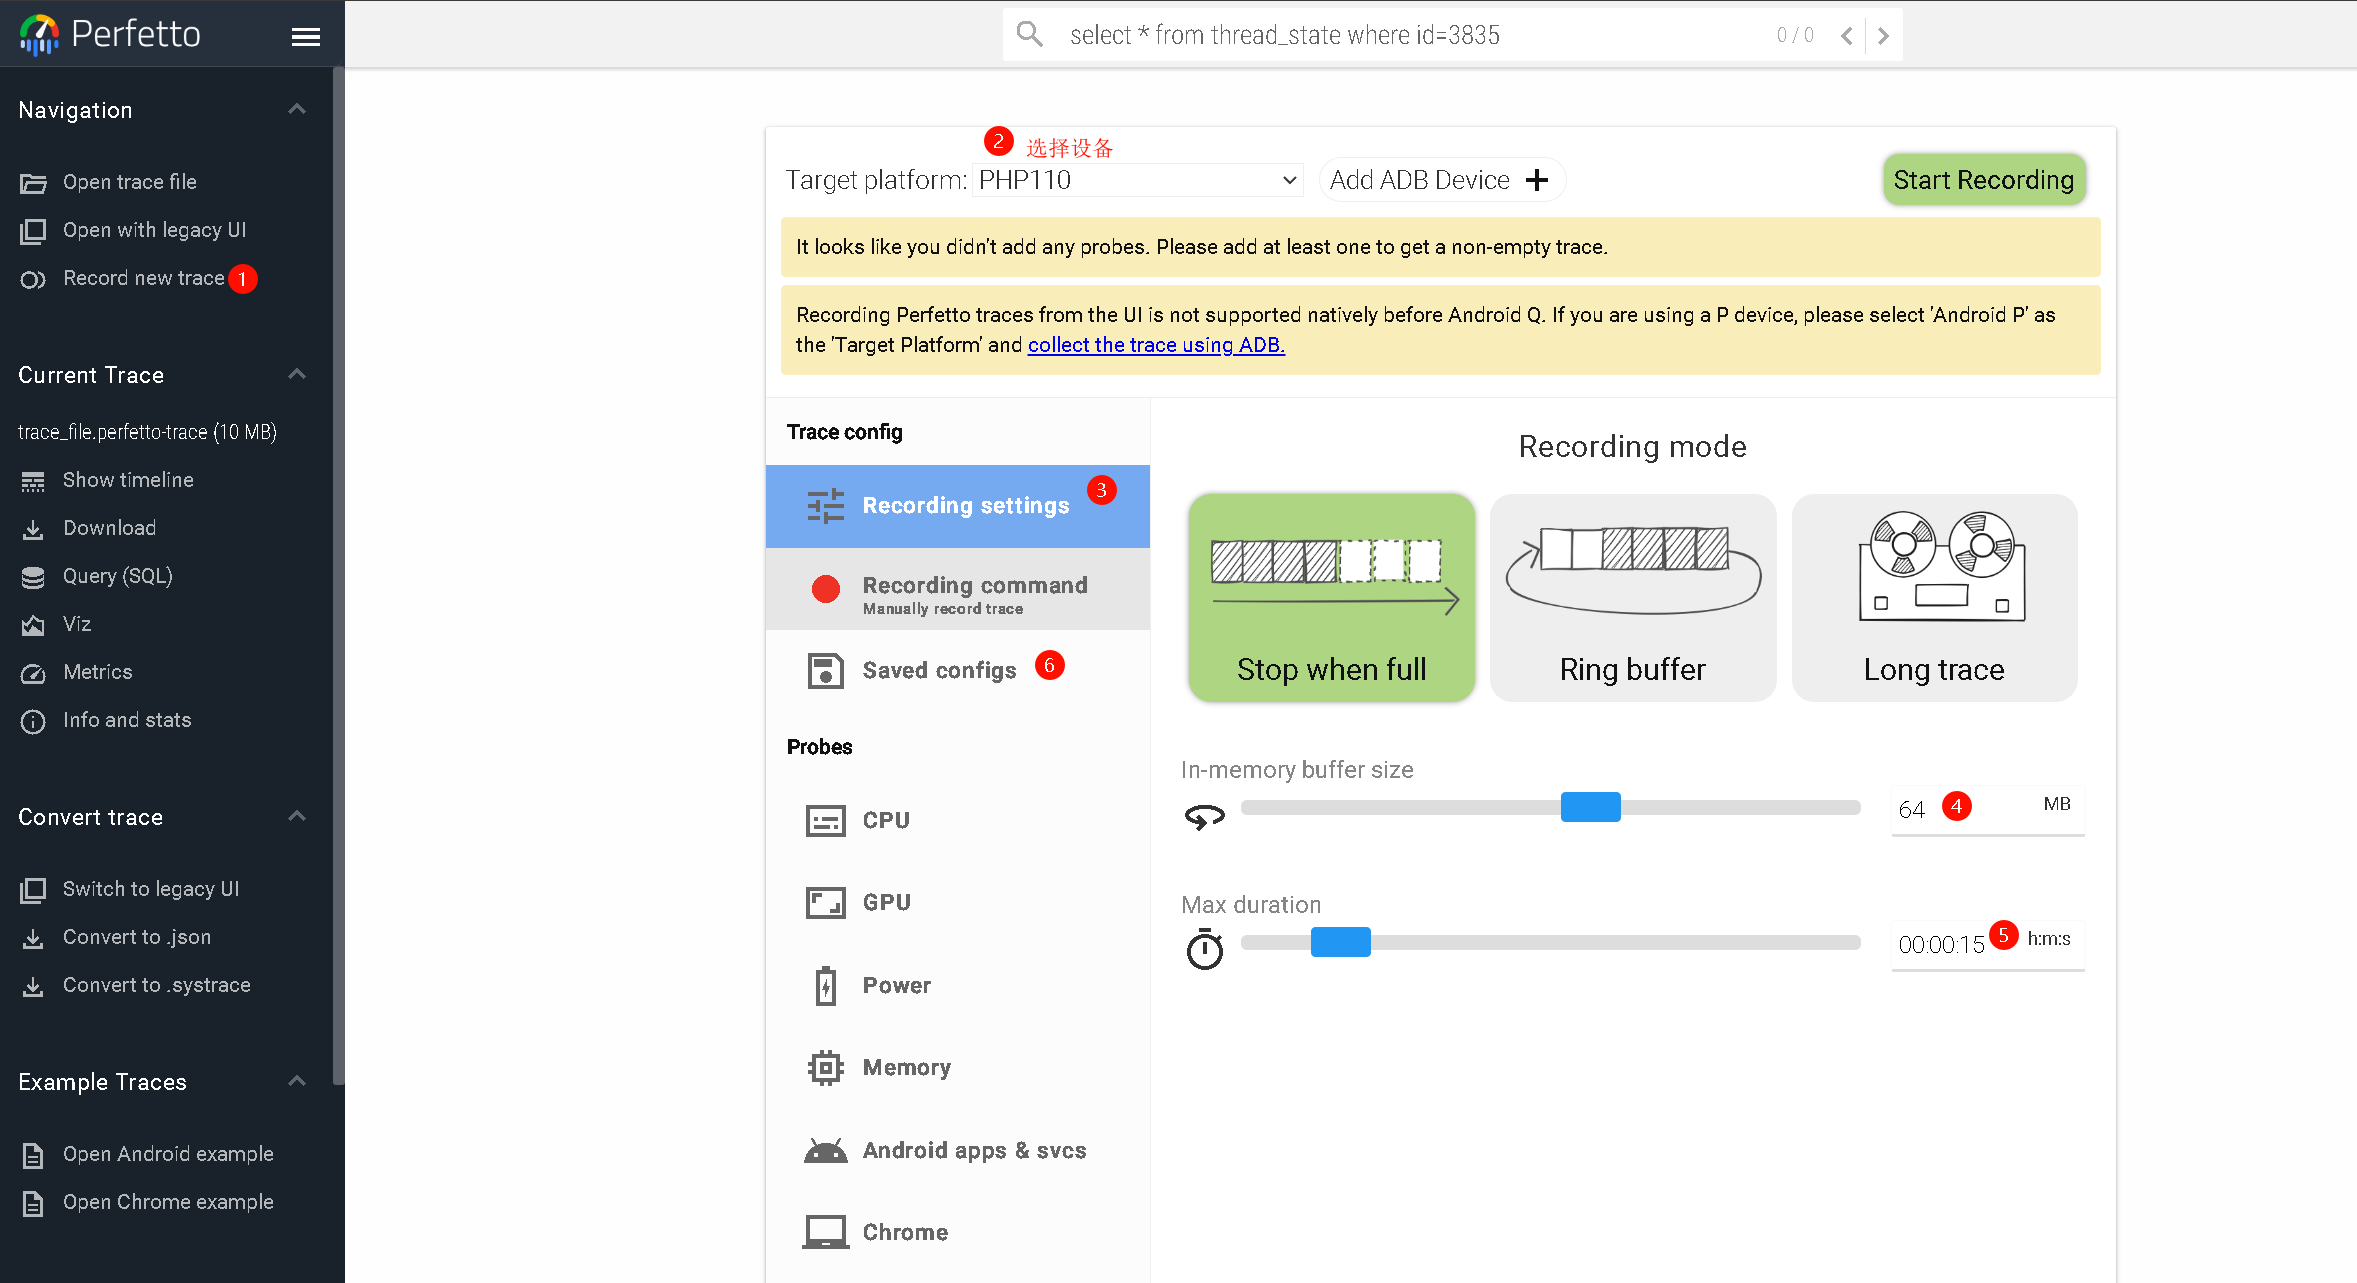
Target platform模板设备Trace configtrace 配置Probes模块设置
Recording settings
三种录制设置,适用不同的使用场景
Stop when full
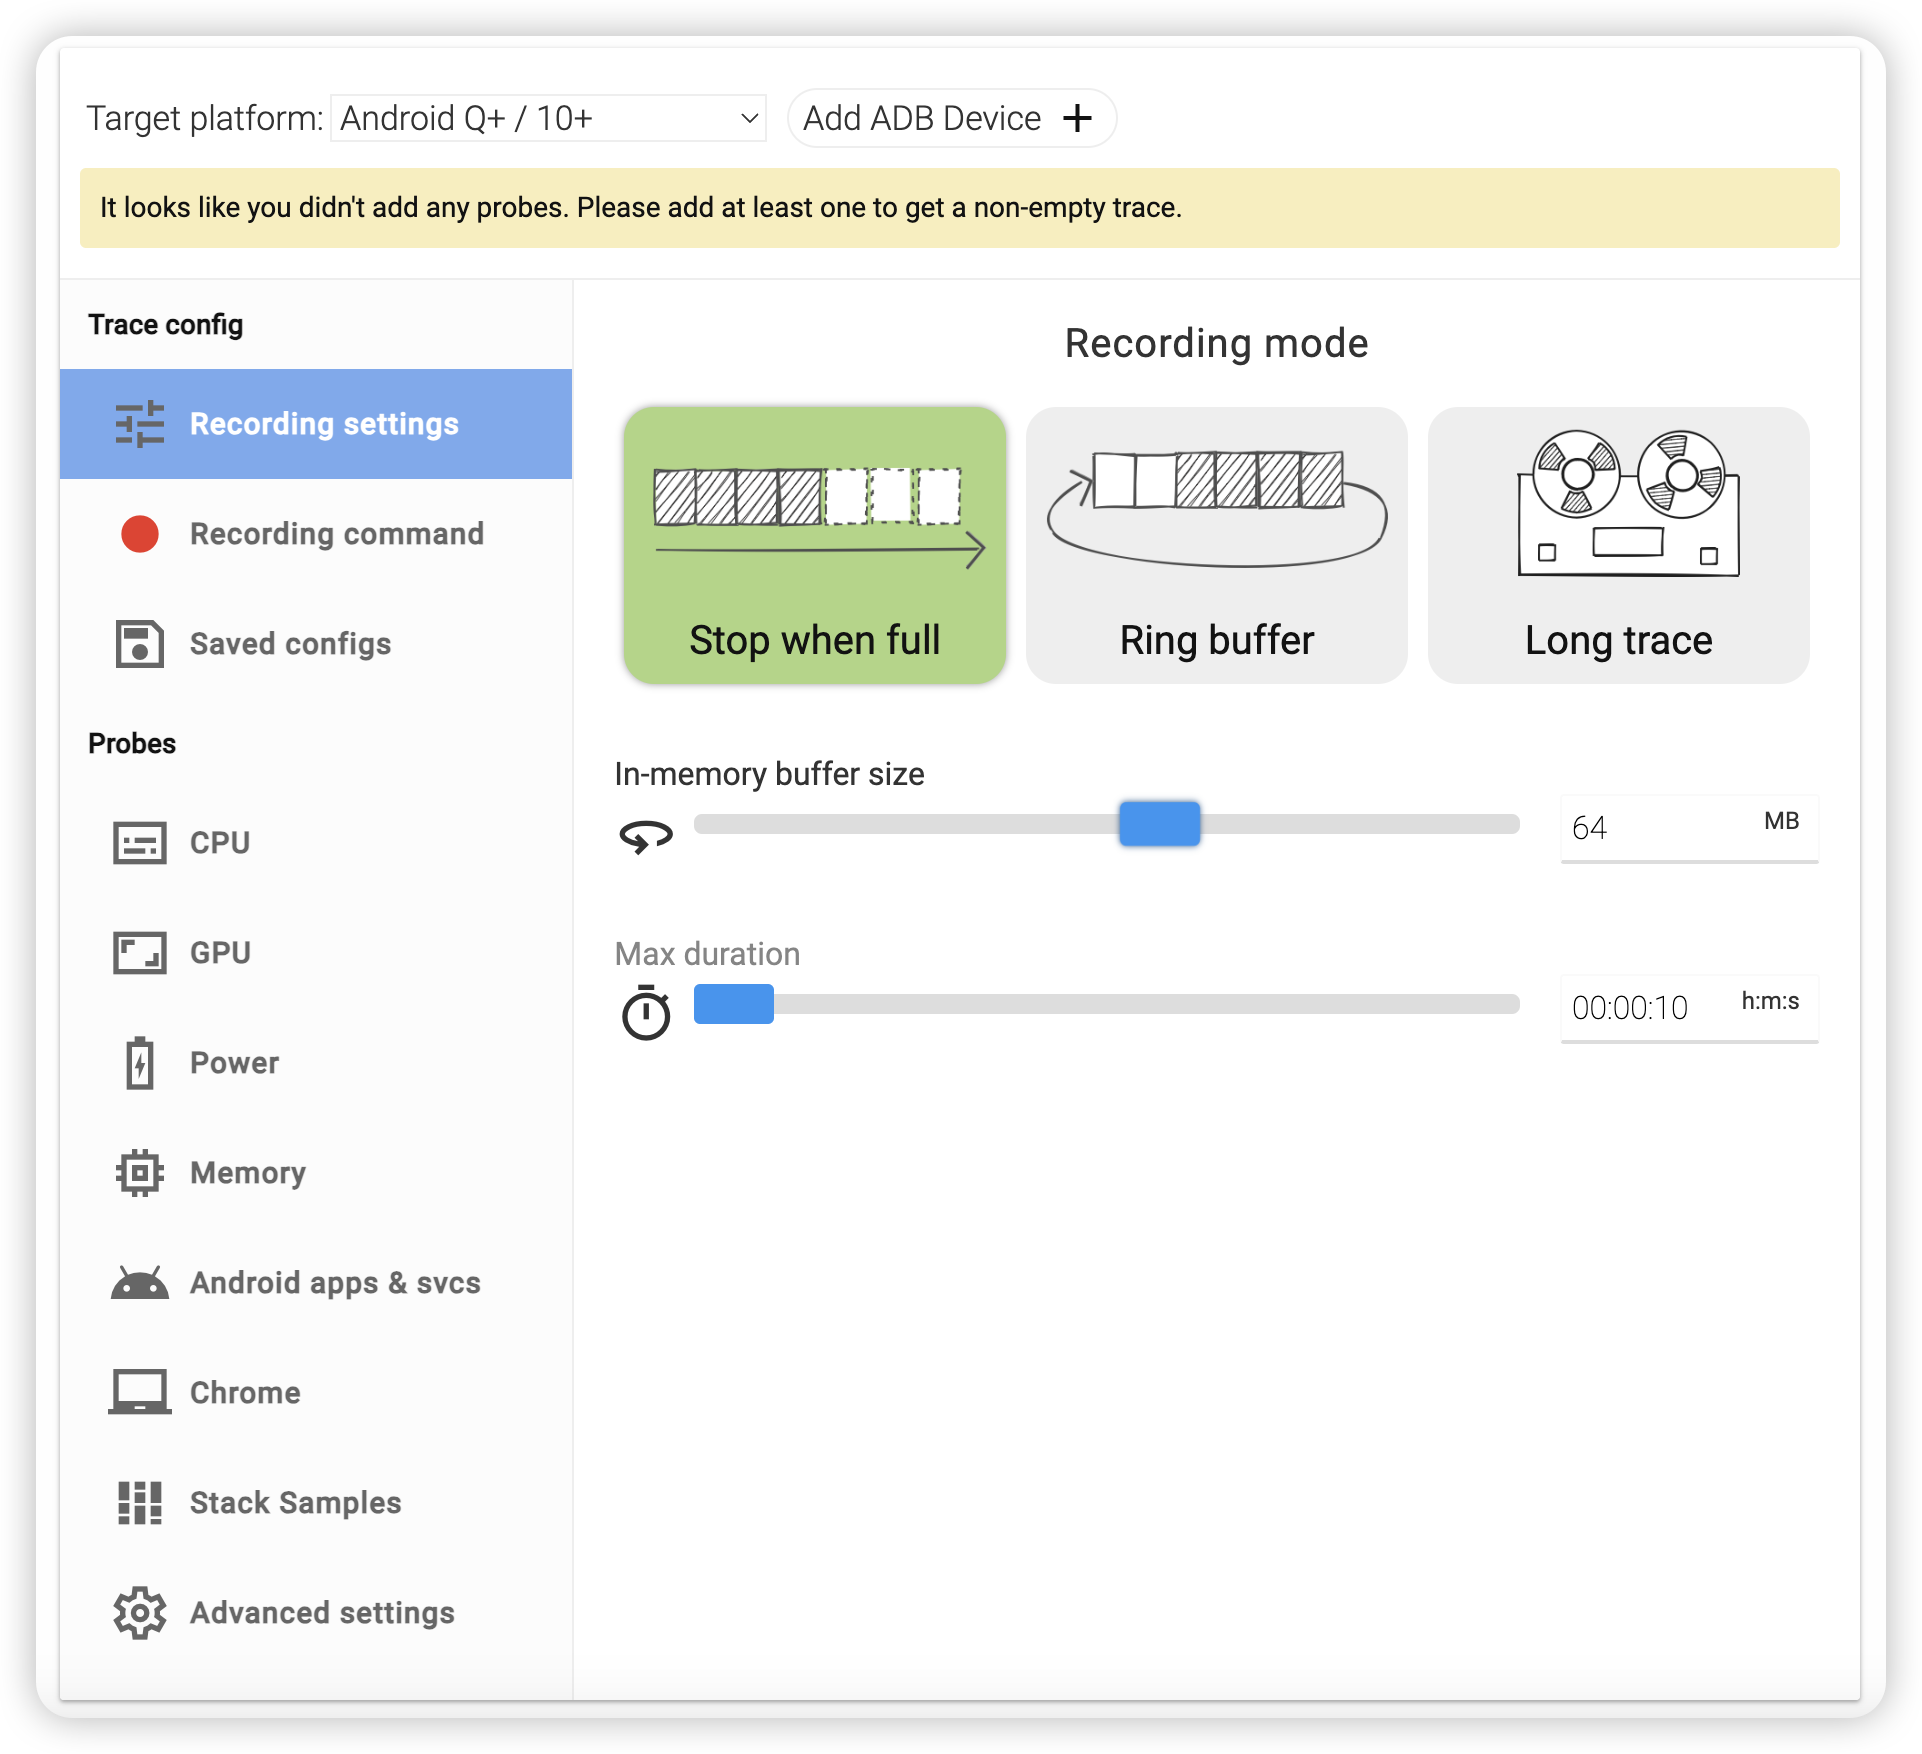
In-memory buffer size设置存储 trace 的最大 buffer 大小,存储在内存中,不会影响到 IO。Max duration设置此次 trace 抓取的最大时长- 该模式下 Perfetto 的停止受 buffer 大小和 trace 时长的控制,满足两个任意条件之一,即可停止 trace。
- 优点:trace 不会因为 overwrite 而导致丢失。
- 缺点:如果 trace 太多,会导致提前结束,无法录制到出现问题时候的 trace。
Ring buffer
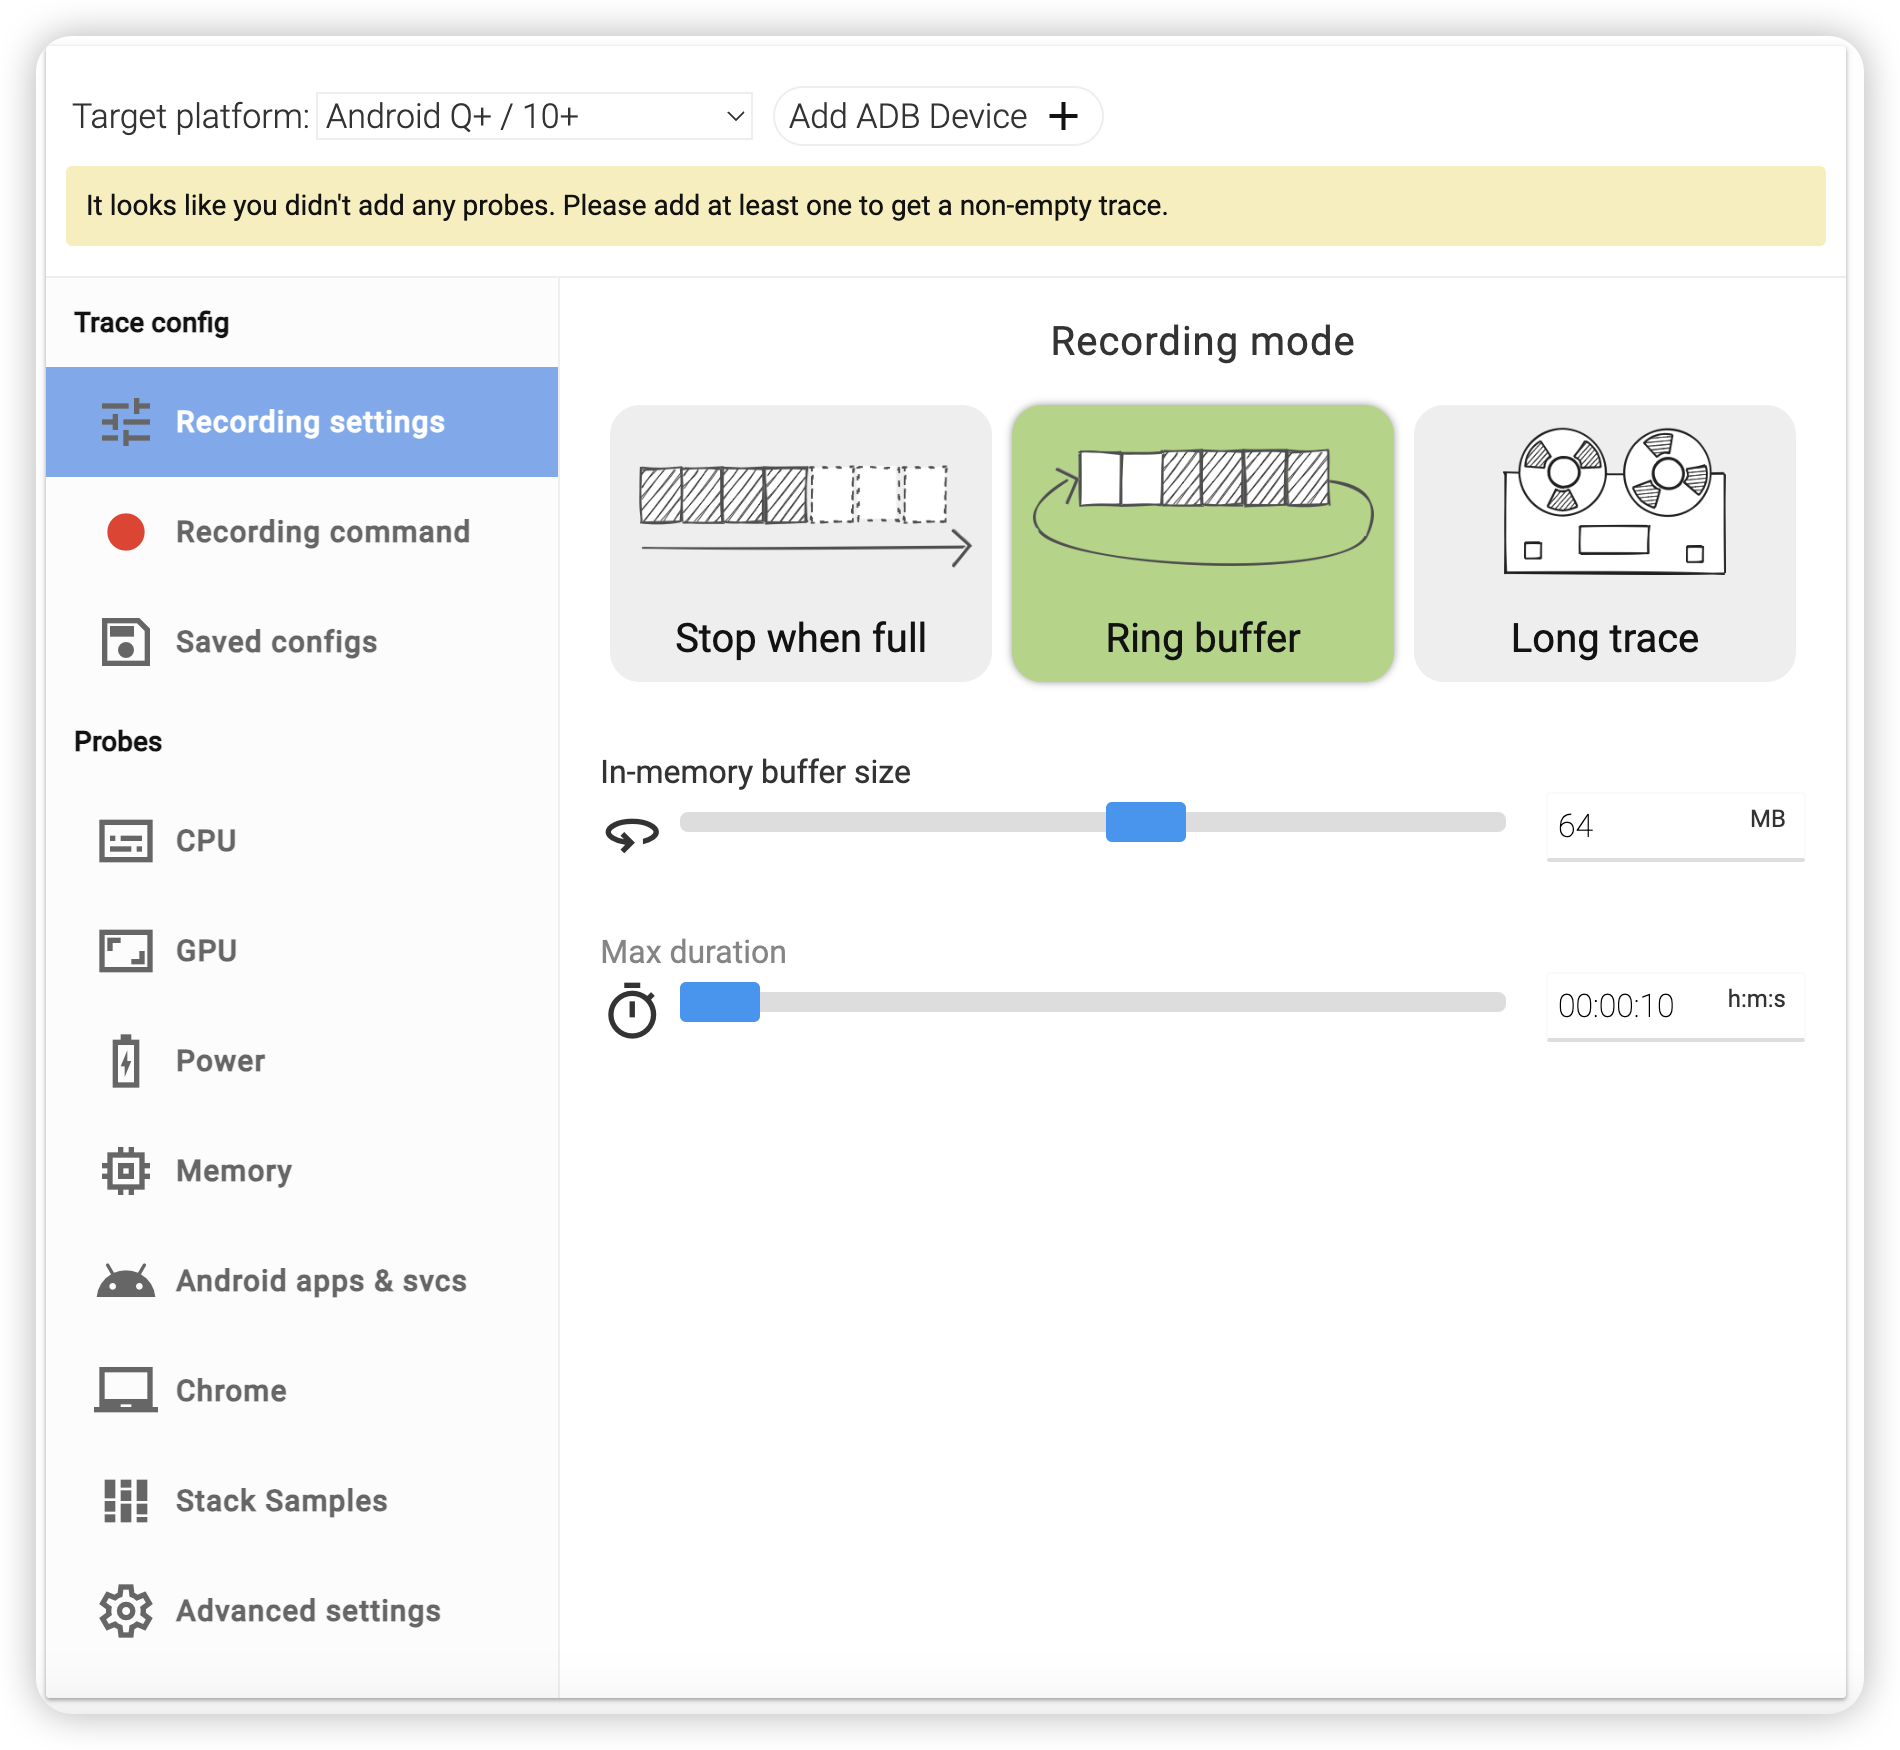
该模式只会收到 Max duration 的影响,时间到了就停止抓取 trace,但是 trace 会有被 overwrite 的风险。
Long trace
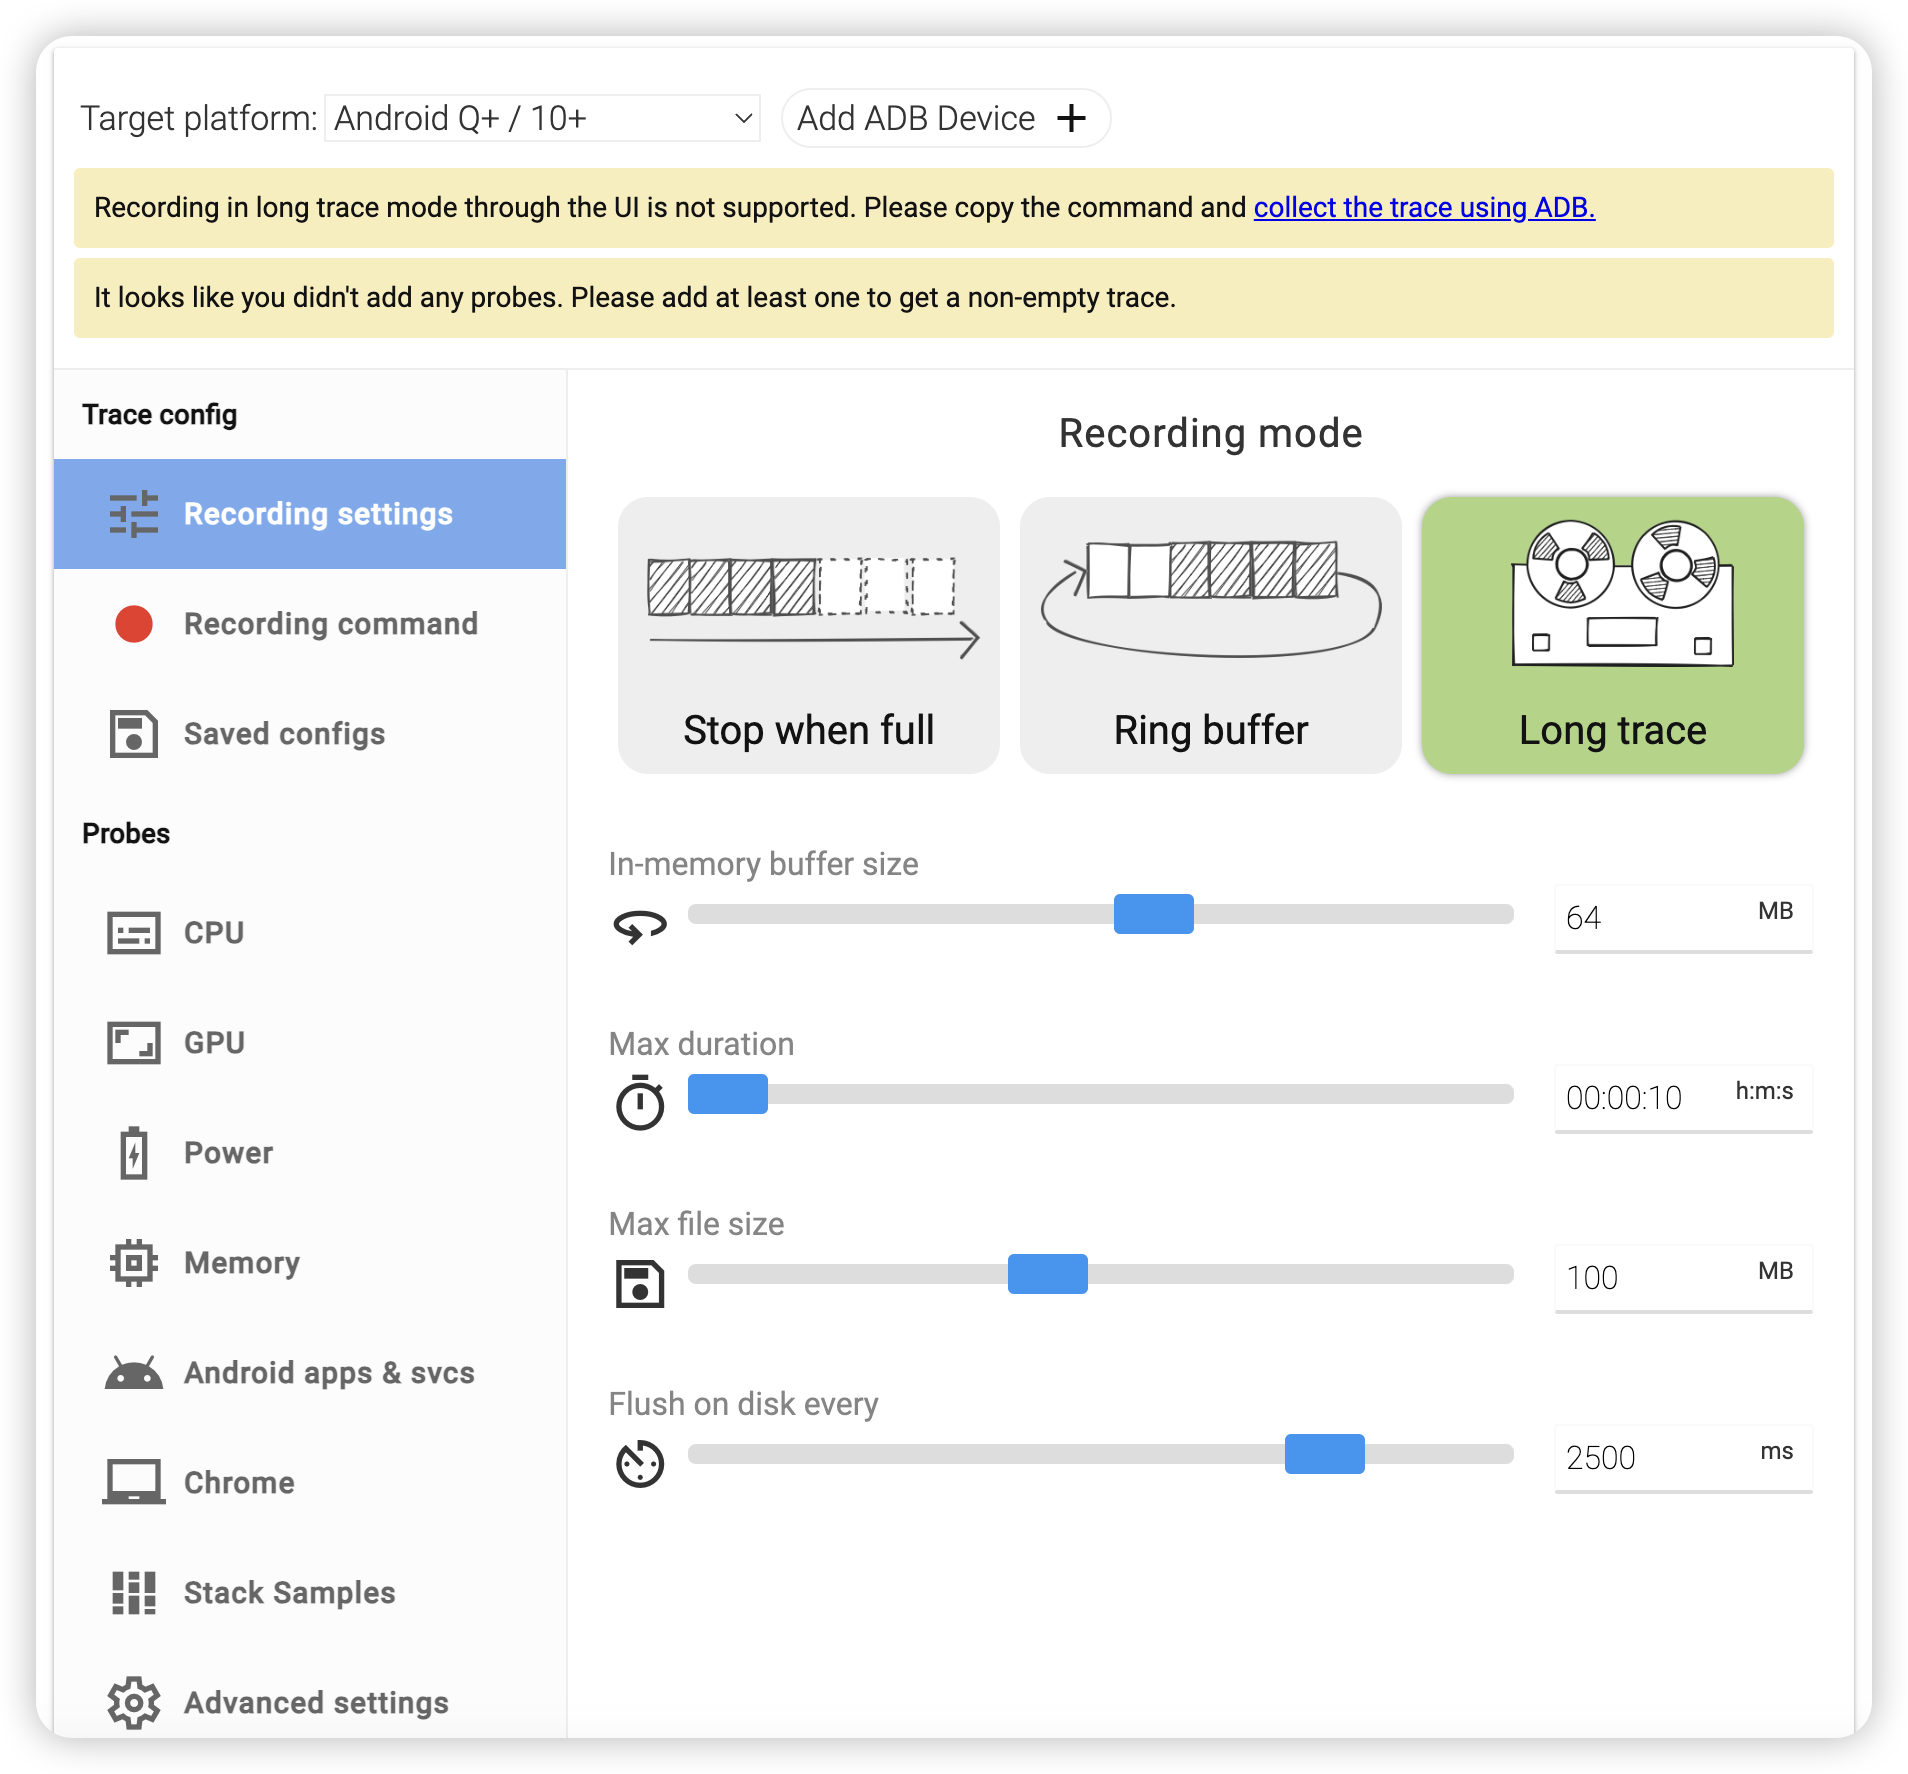
用于长时间地抓取 trace,但是由于需要定时将 buffer 中的 trace 写到文件里面去,会有 IO 的影响。
Flush on disk every间隔多长时间将 buffer 中的 trace 写入到文件,这个数值不能太大也不能太小,太大容易丢 trace,太小容易出现 IO 问题。trace 的停止主要受控于 Max duration,或者手动停止。
Recording command
配置汇总和执行,完成相关参数配置后,可以在改选项中获得所有的配置参数,拷贝命令,直接 adb 开启录制追踪。
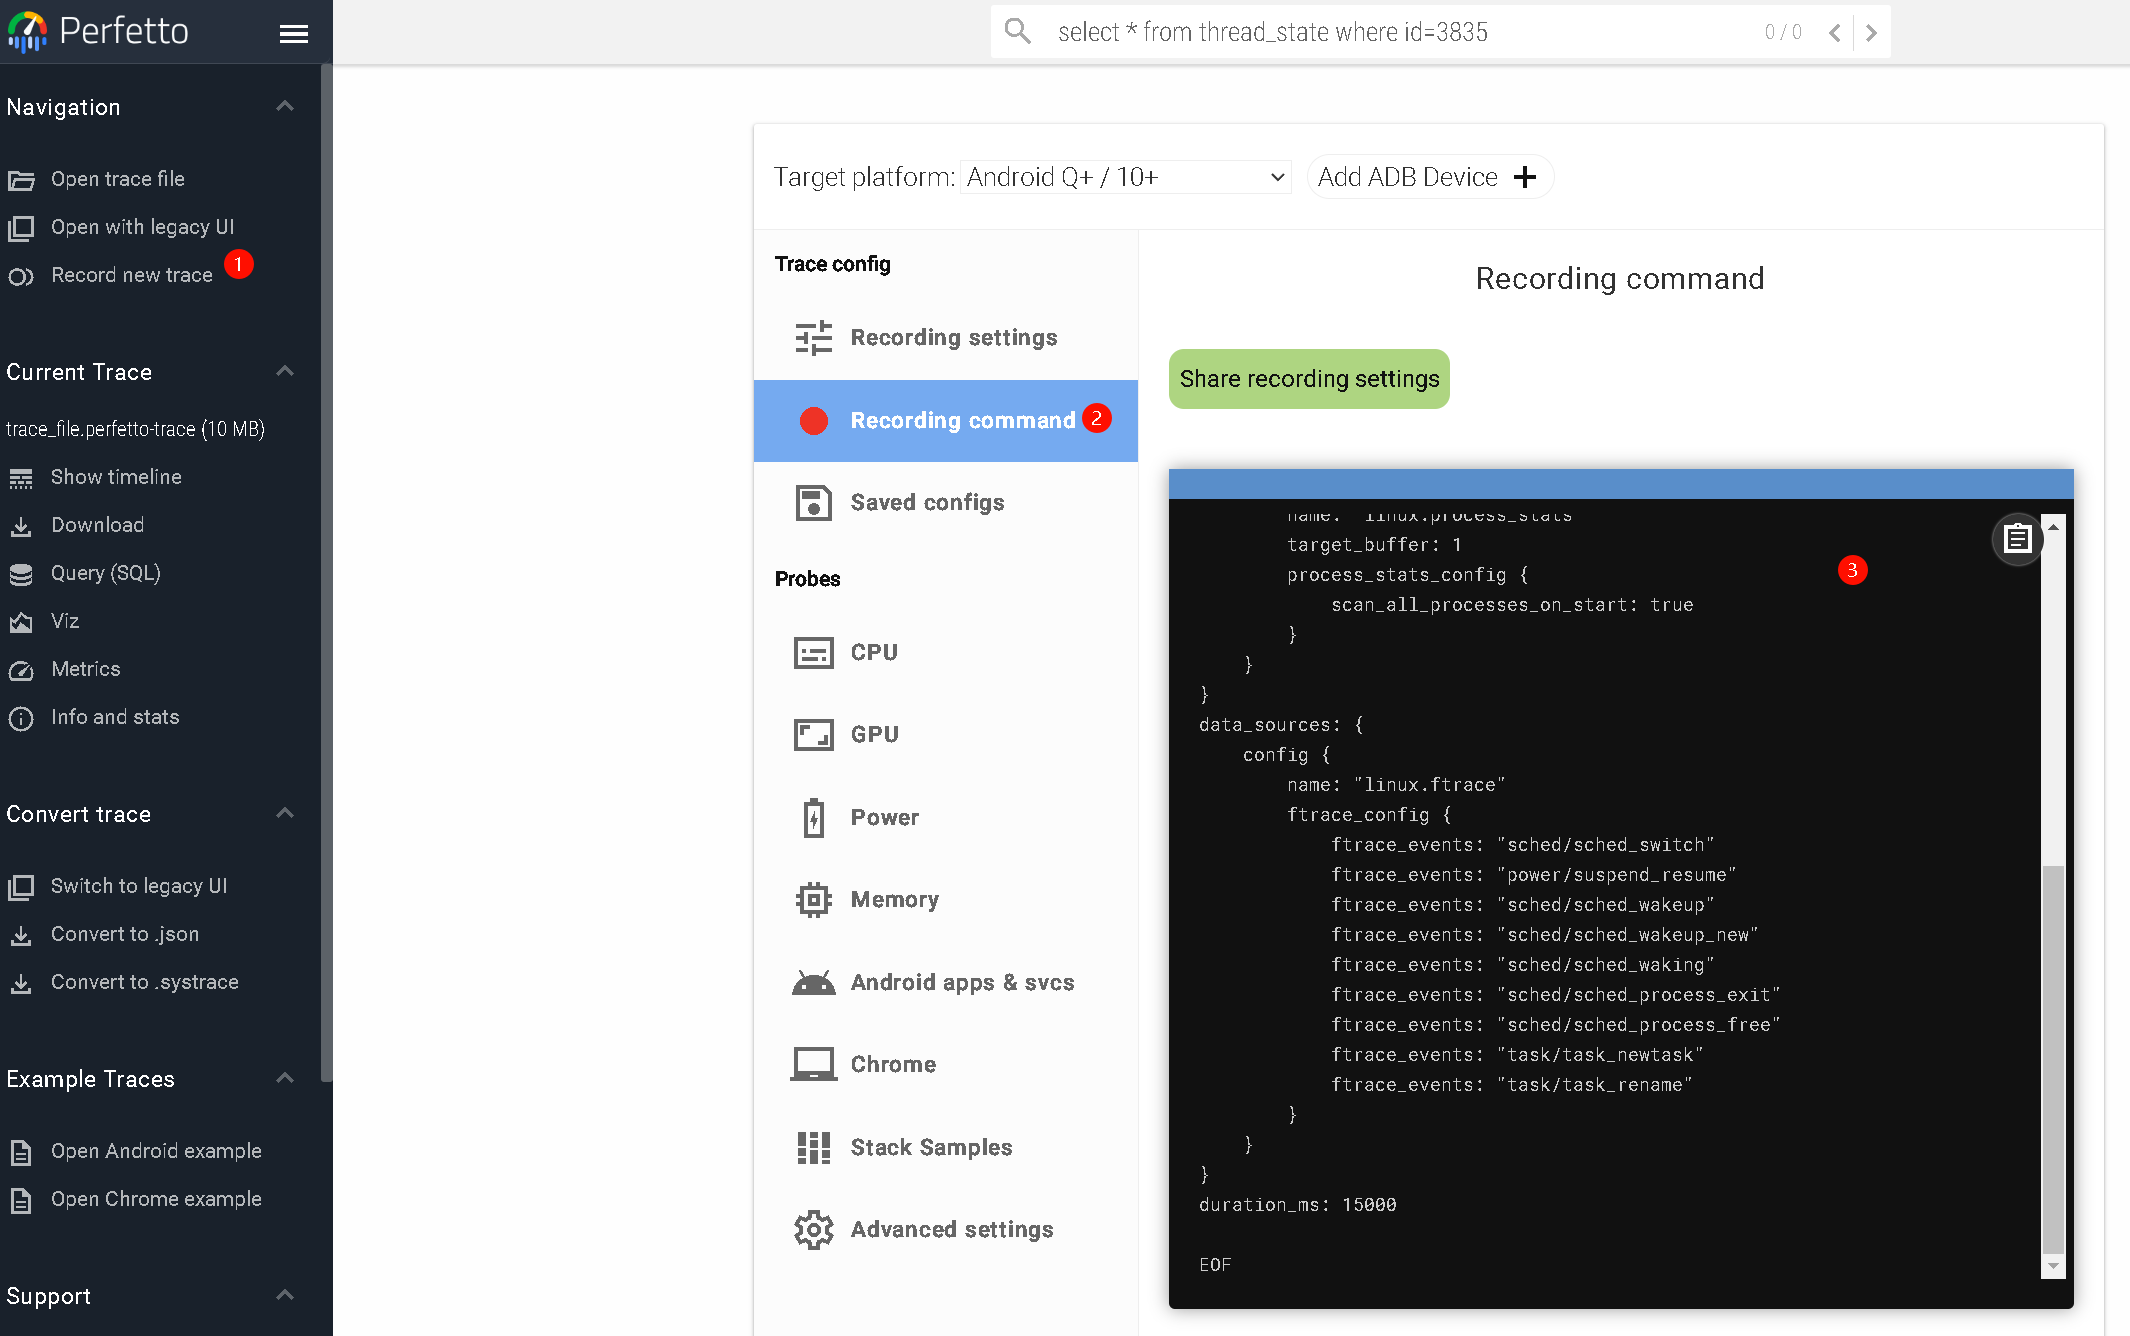
在 shell 中可以直接复制配置文件通过 adb 设置到到设备中,可以手动修改 duration_ms 参数来修改抓取 trace 时间。
或者不使用配置文件。通过命令行方式执行,但需要手动键入需要抓取的模块。
adb shell perfetto -o /data/misc/perfetto-traces/trace_file.perfetto-trace -t 20s \
sched freq idle am wm gfx view binder_driver hal dalvik camera input res memory
Probes
CPU
CPU 相关的常见功能统计
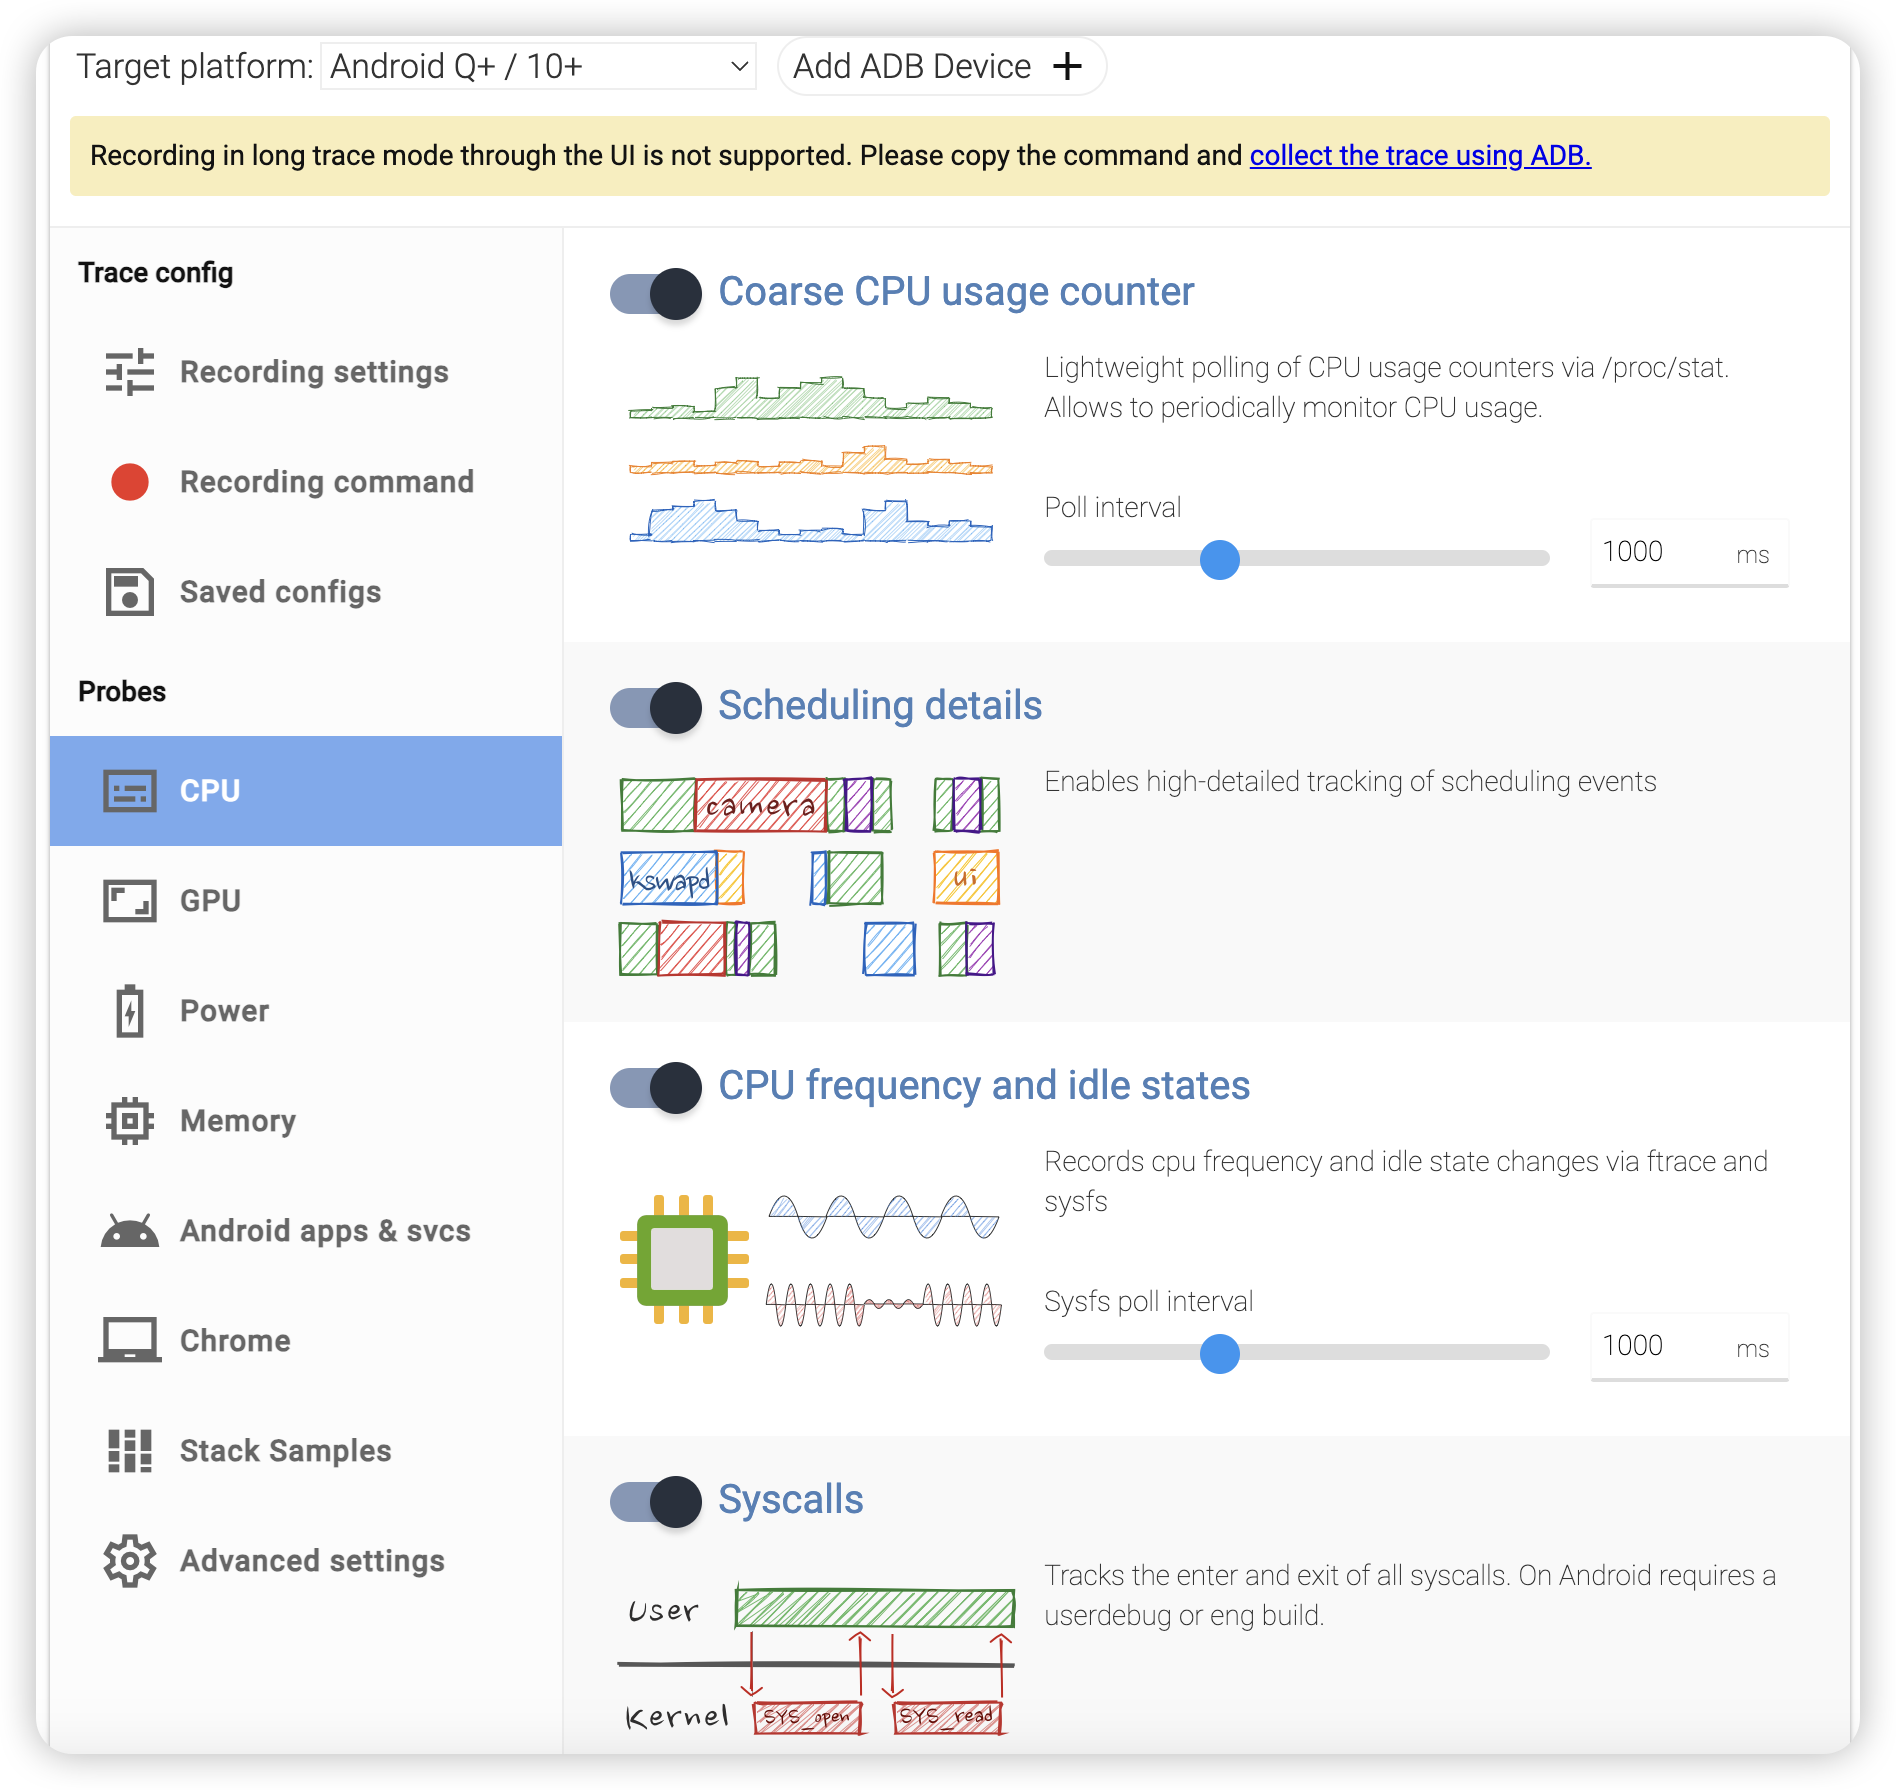
Coarse CPU usage counter粗粒度的 CPU 相关使用统计Scheduling details详细查看 CPU 运行的每个 task
CPU frequency and idle states查看每颗 CPU 的运行频率和是否空闲Syscalls记录每一个系统调用,对性能影响较大,需要 userdebug 版本。
GPU
记录 GPU 的主频和内存使用
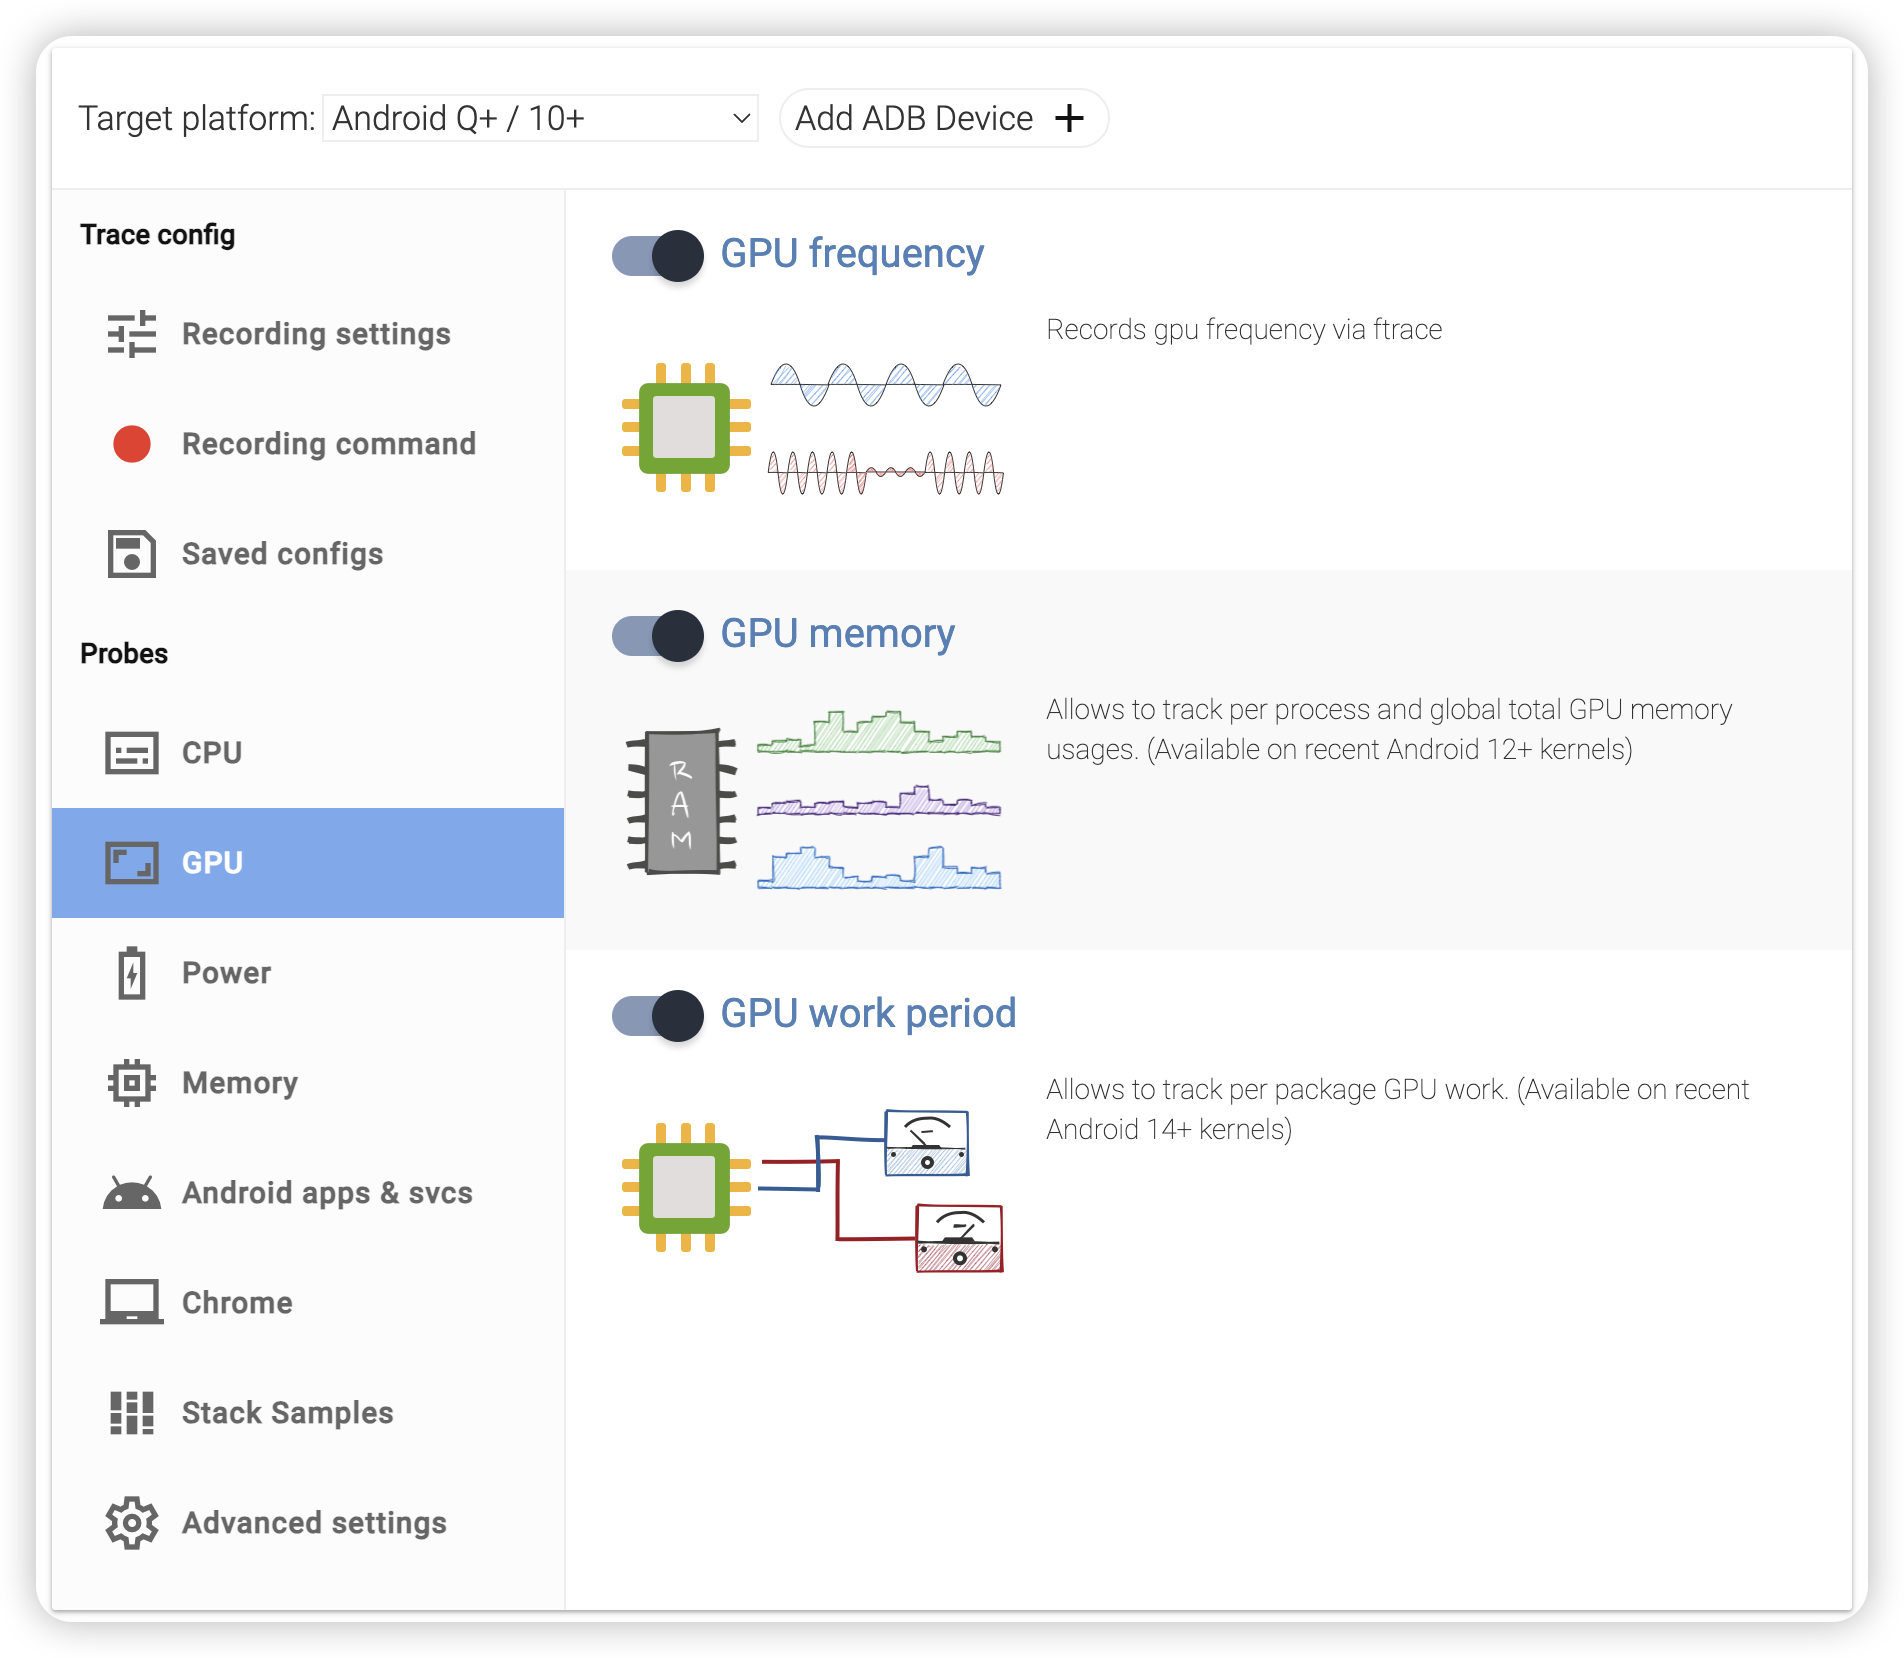
GPU frequency

GPU memoryGPU 内存使用量及各个进程的占用,仅支持 Android 12+

Power
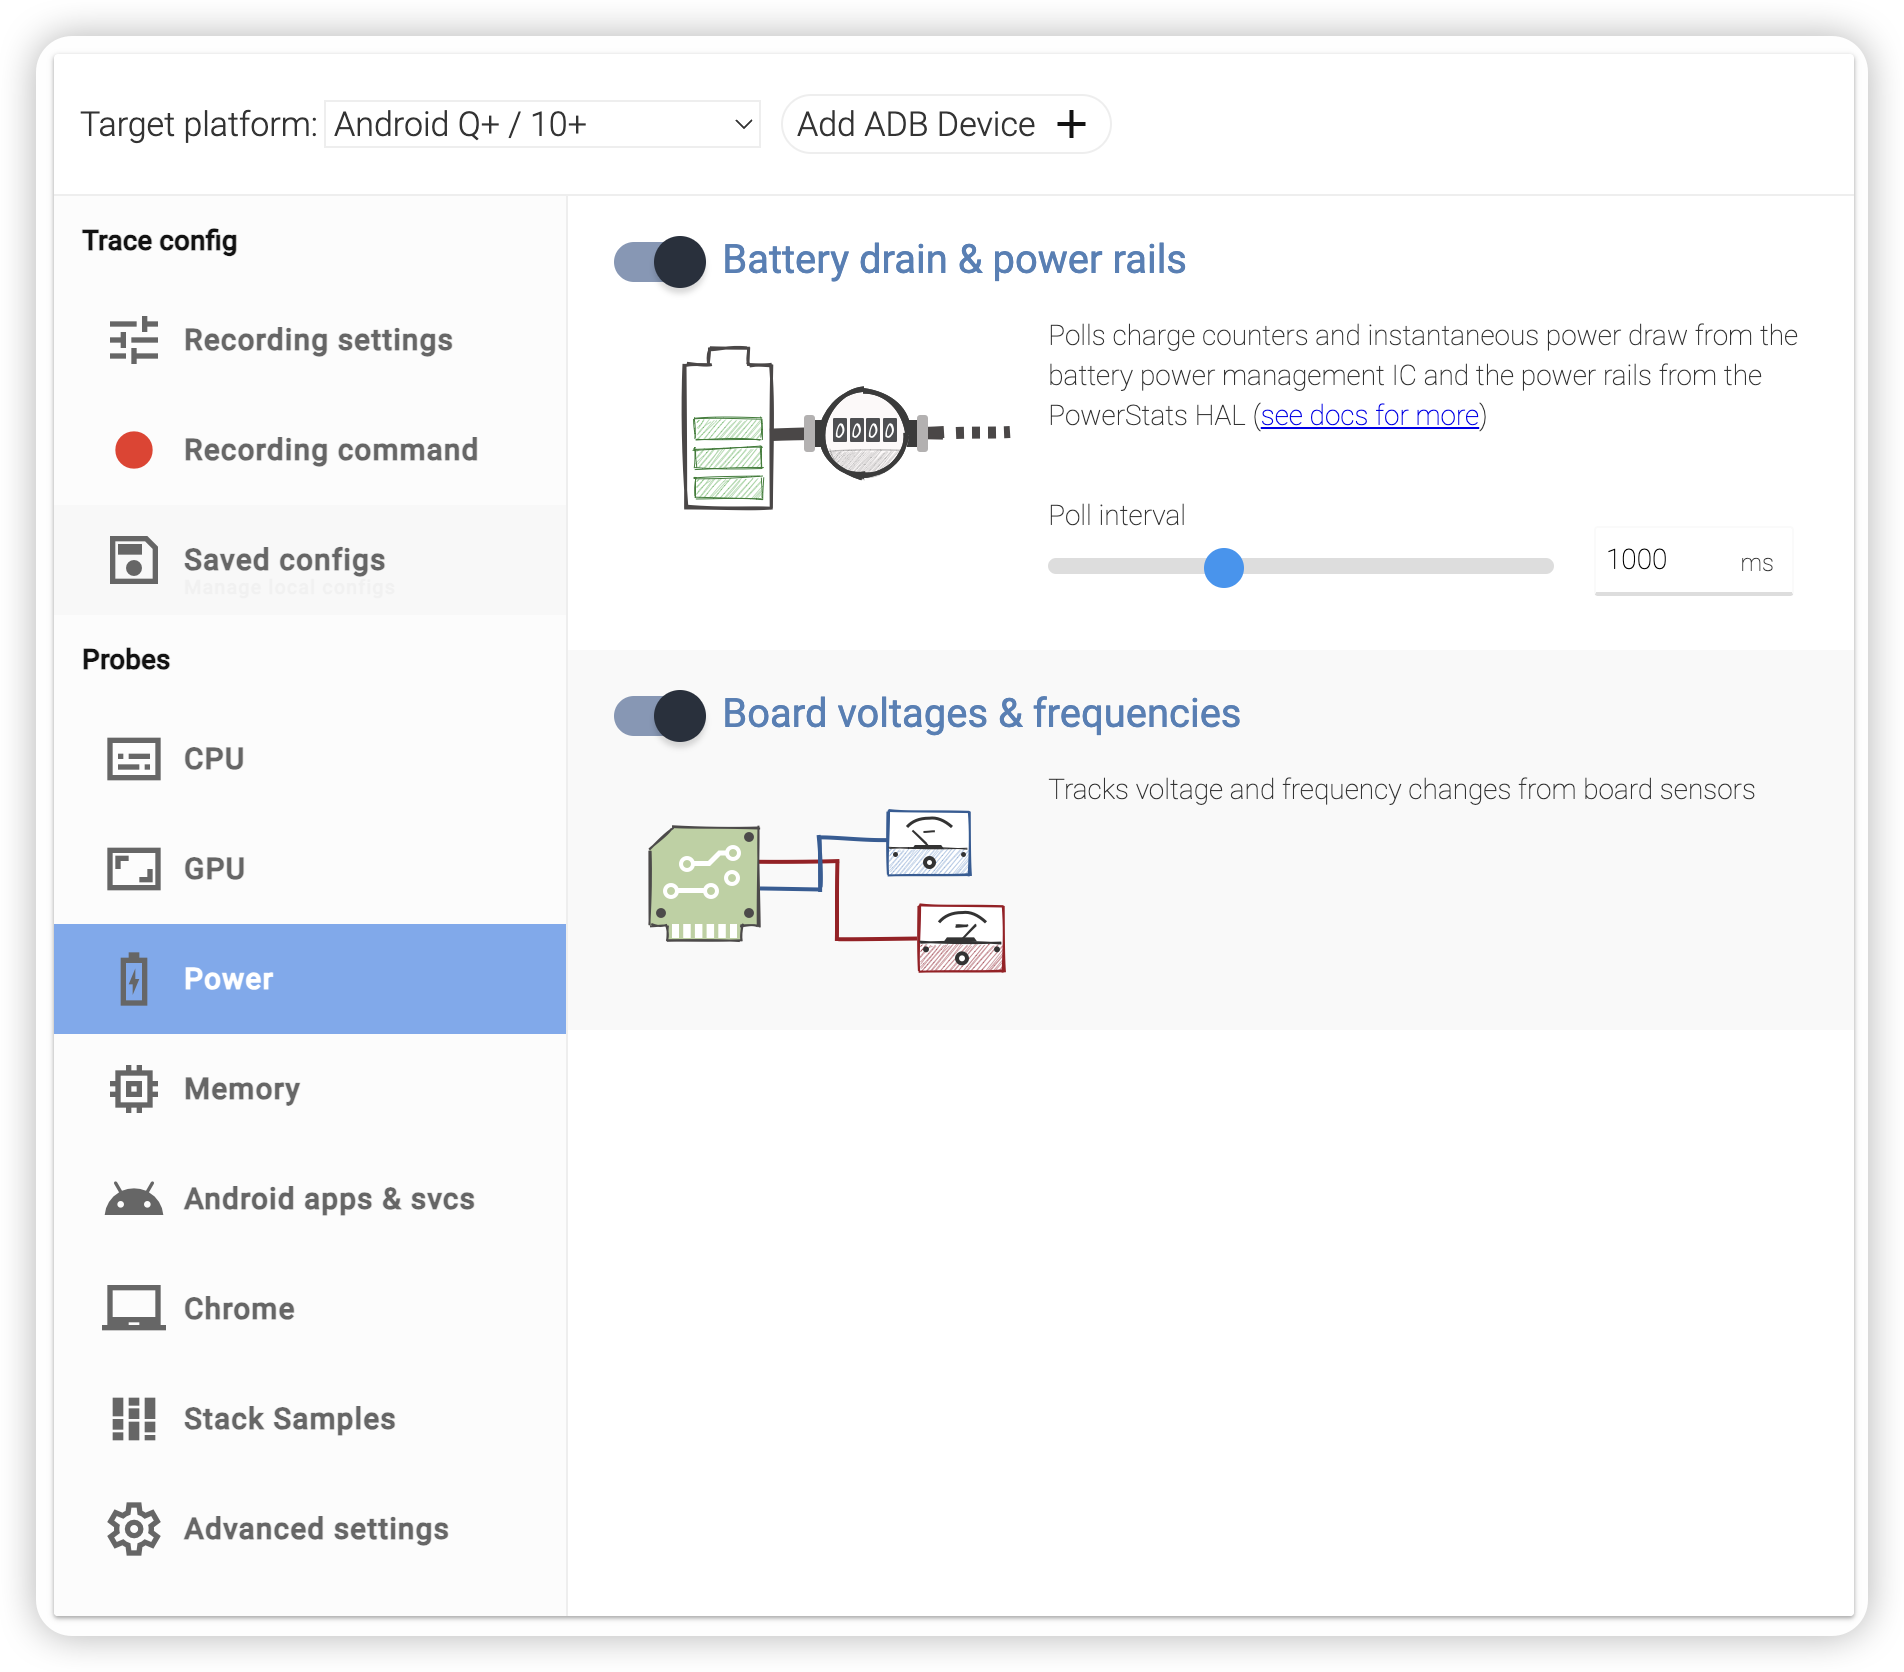
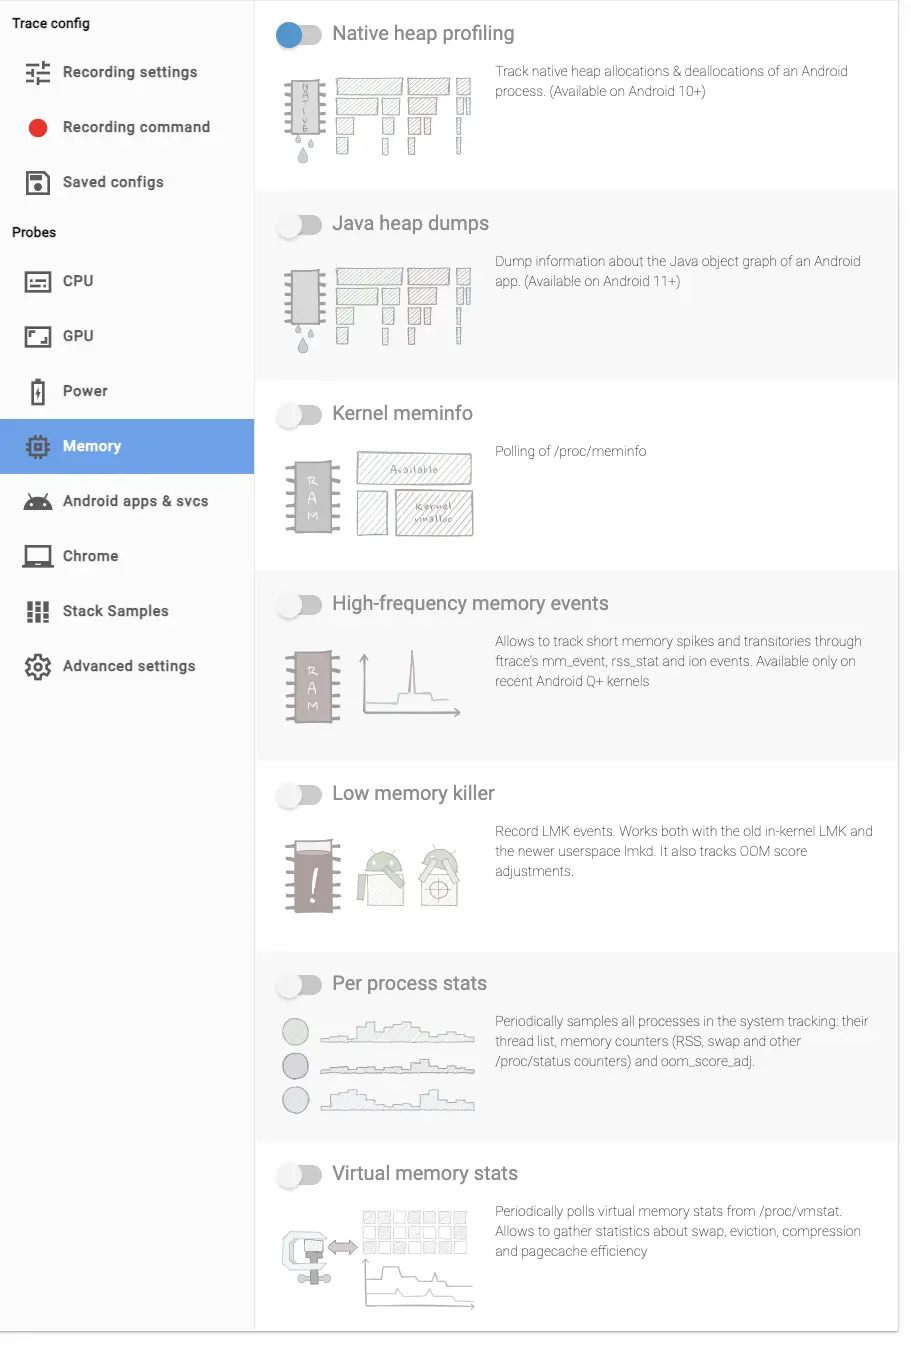
Memory
Android apps & svcs
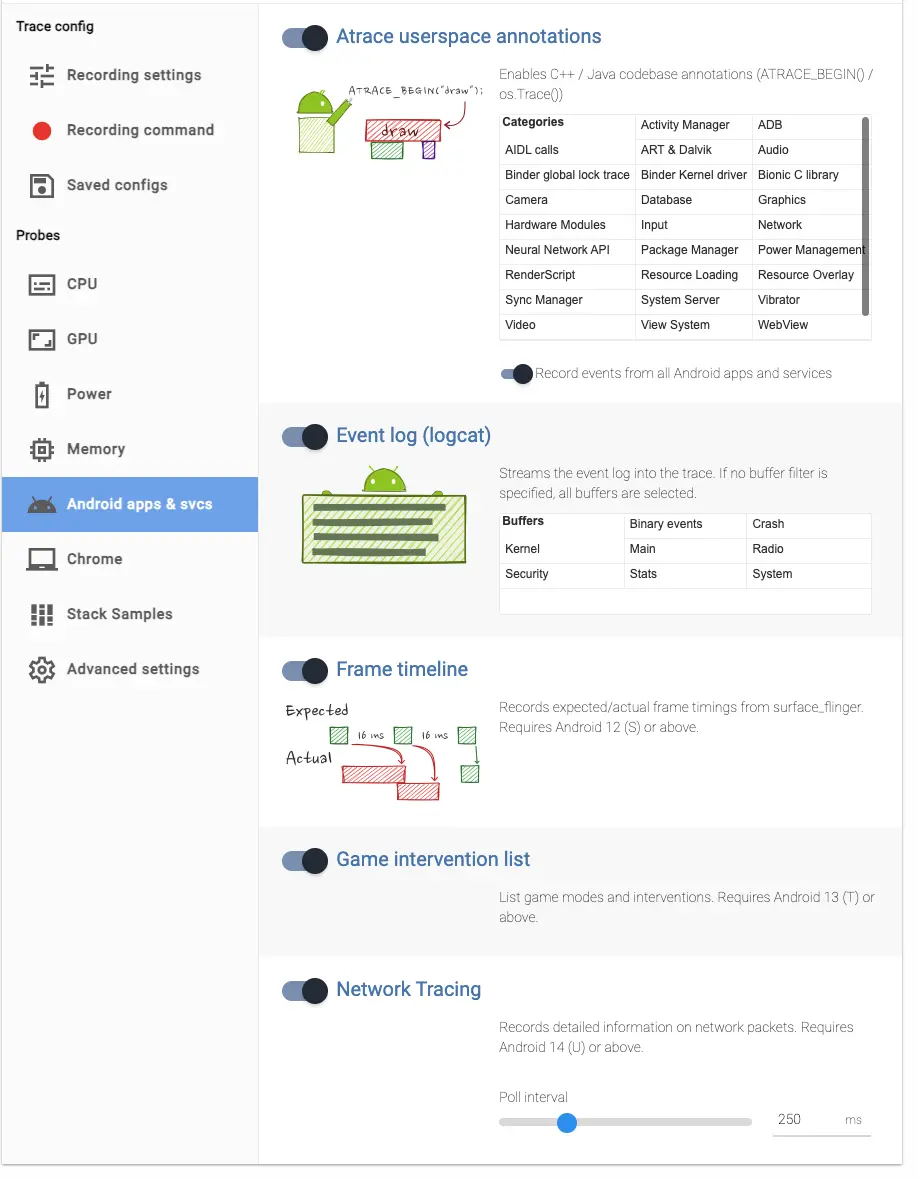
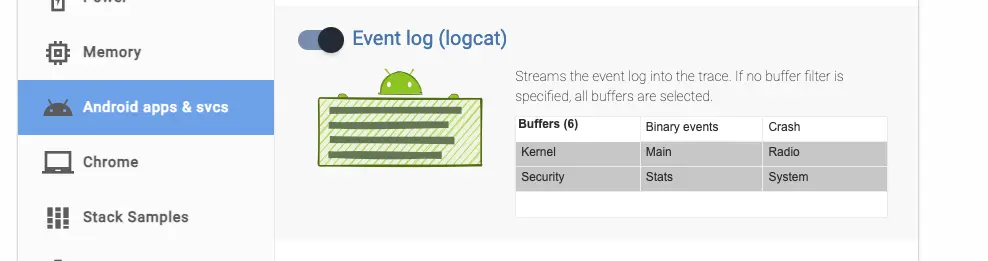
Atrace userspace annotations开启这个选项之后,选择合适的 atrace tag 就可以开启对应的 trace 了,这个 tag 就对应了 System Tracing 的界面的 catergray。Event log (logcat)可以实时记录 log,然后将 log 和 trace 信息一一对应。 选择合适的 log 类型,就可以记录相应的 log。
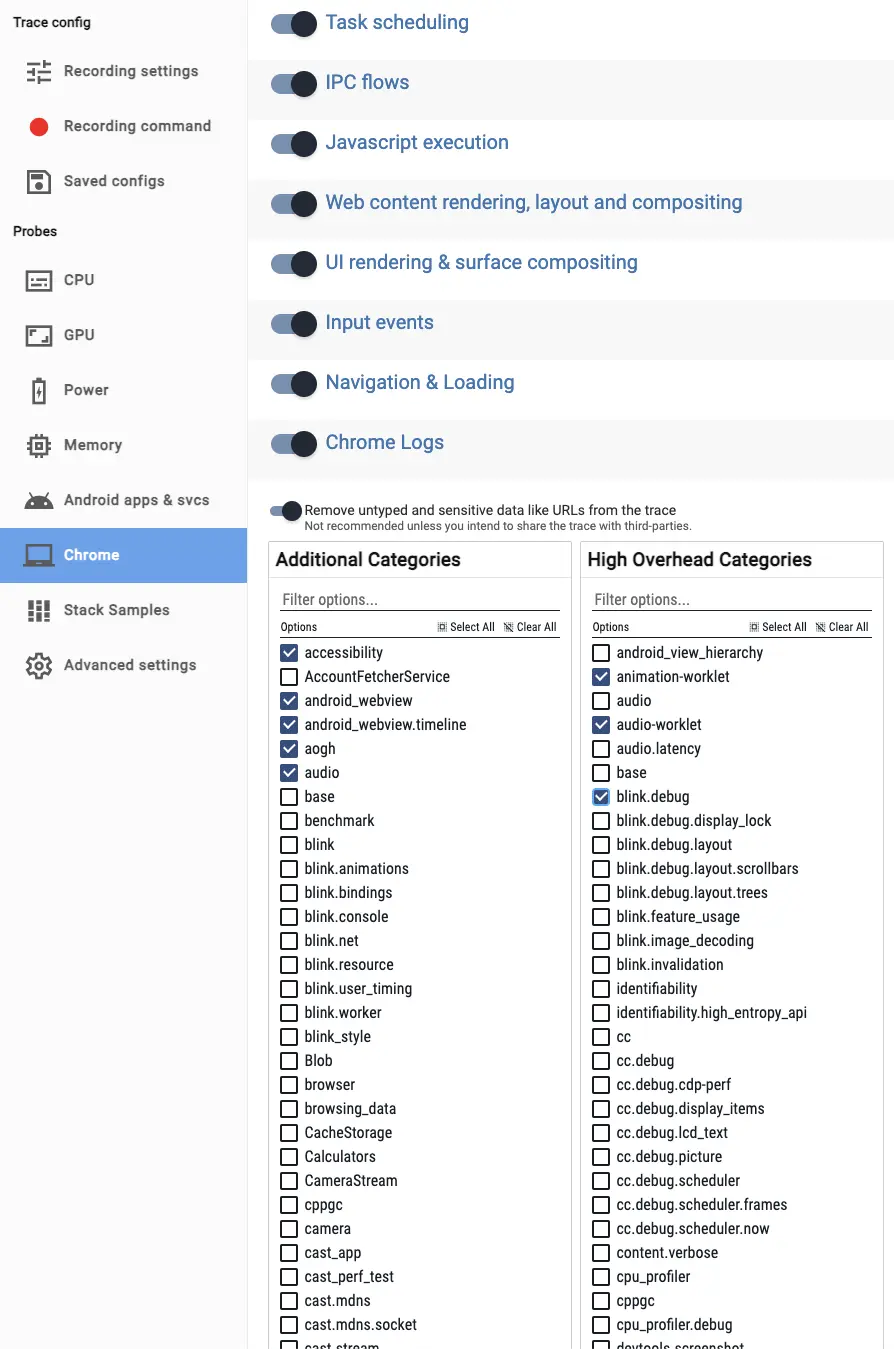
Chrome
如果需要分析 Webview 相关的性能问题,可以开启该选项的相关功能
Stack Samples
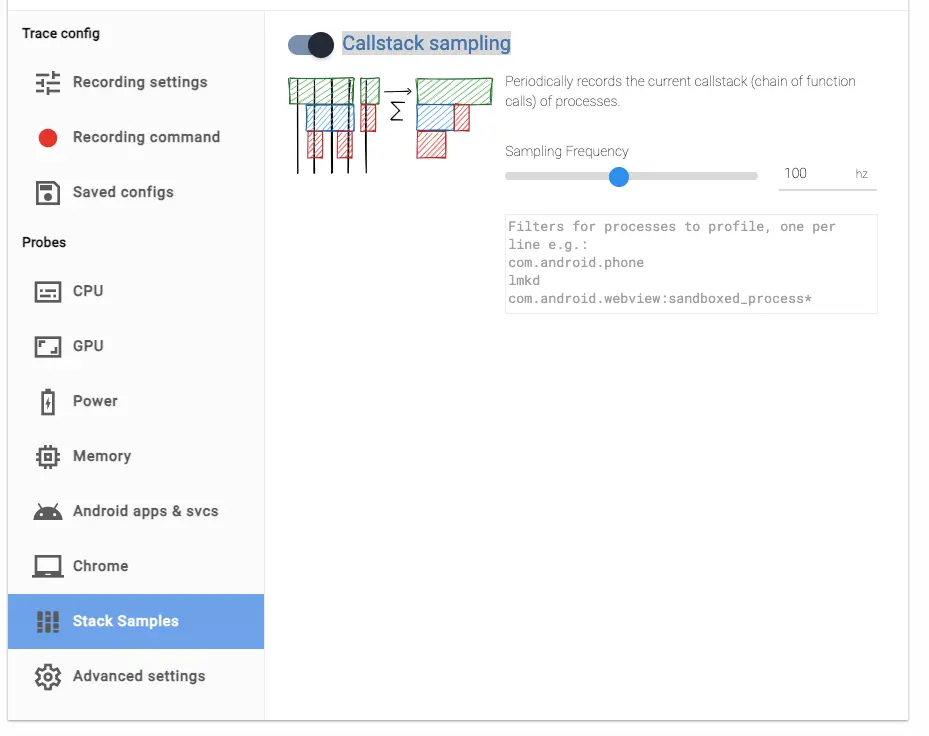
Callstack sampling定期记录进程的当前函数调用堆栈
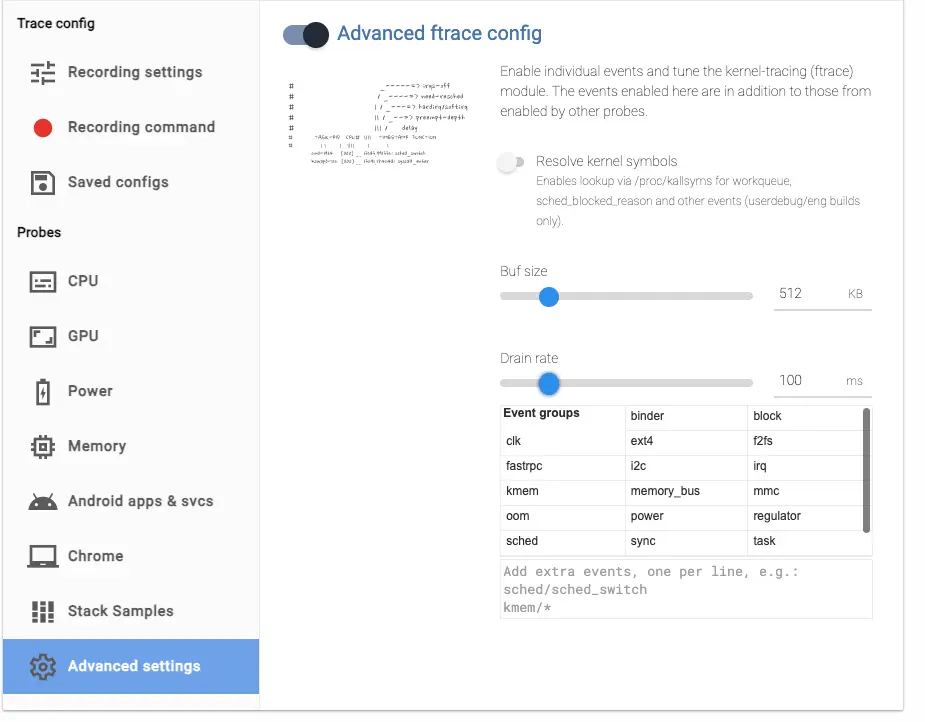
Advanced settings
目前只有一个开启 ftrace 功能,用于分析内核性能问题,可以选择相应的 tag 进行记录
查看 trace 报告
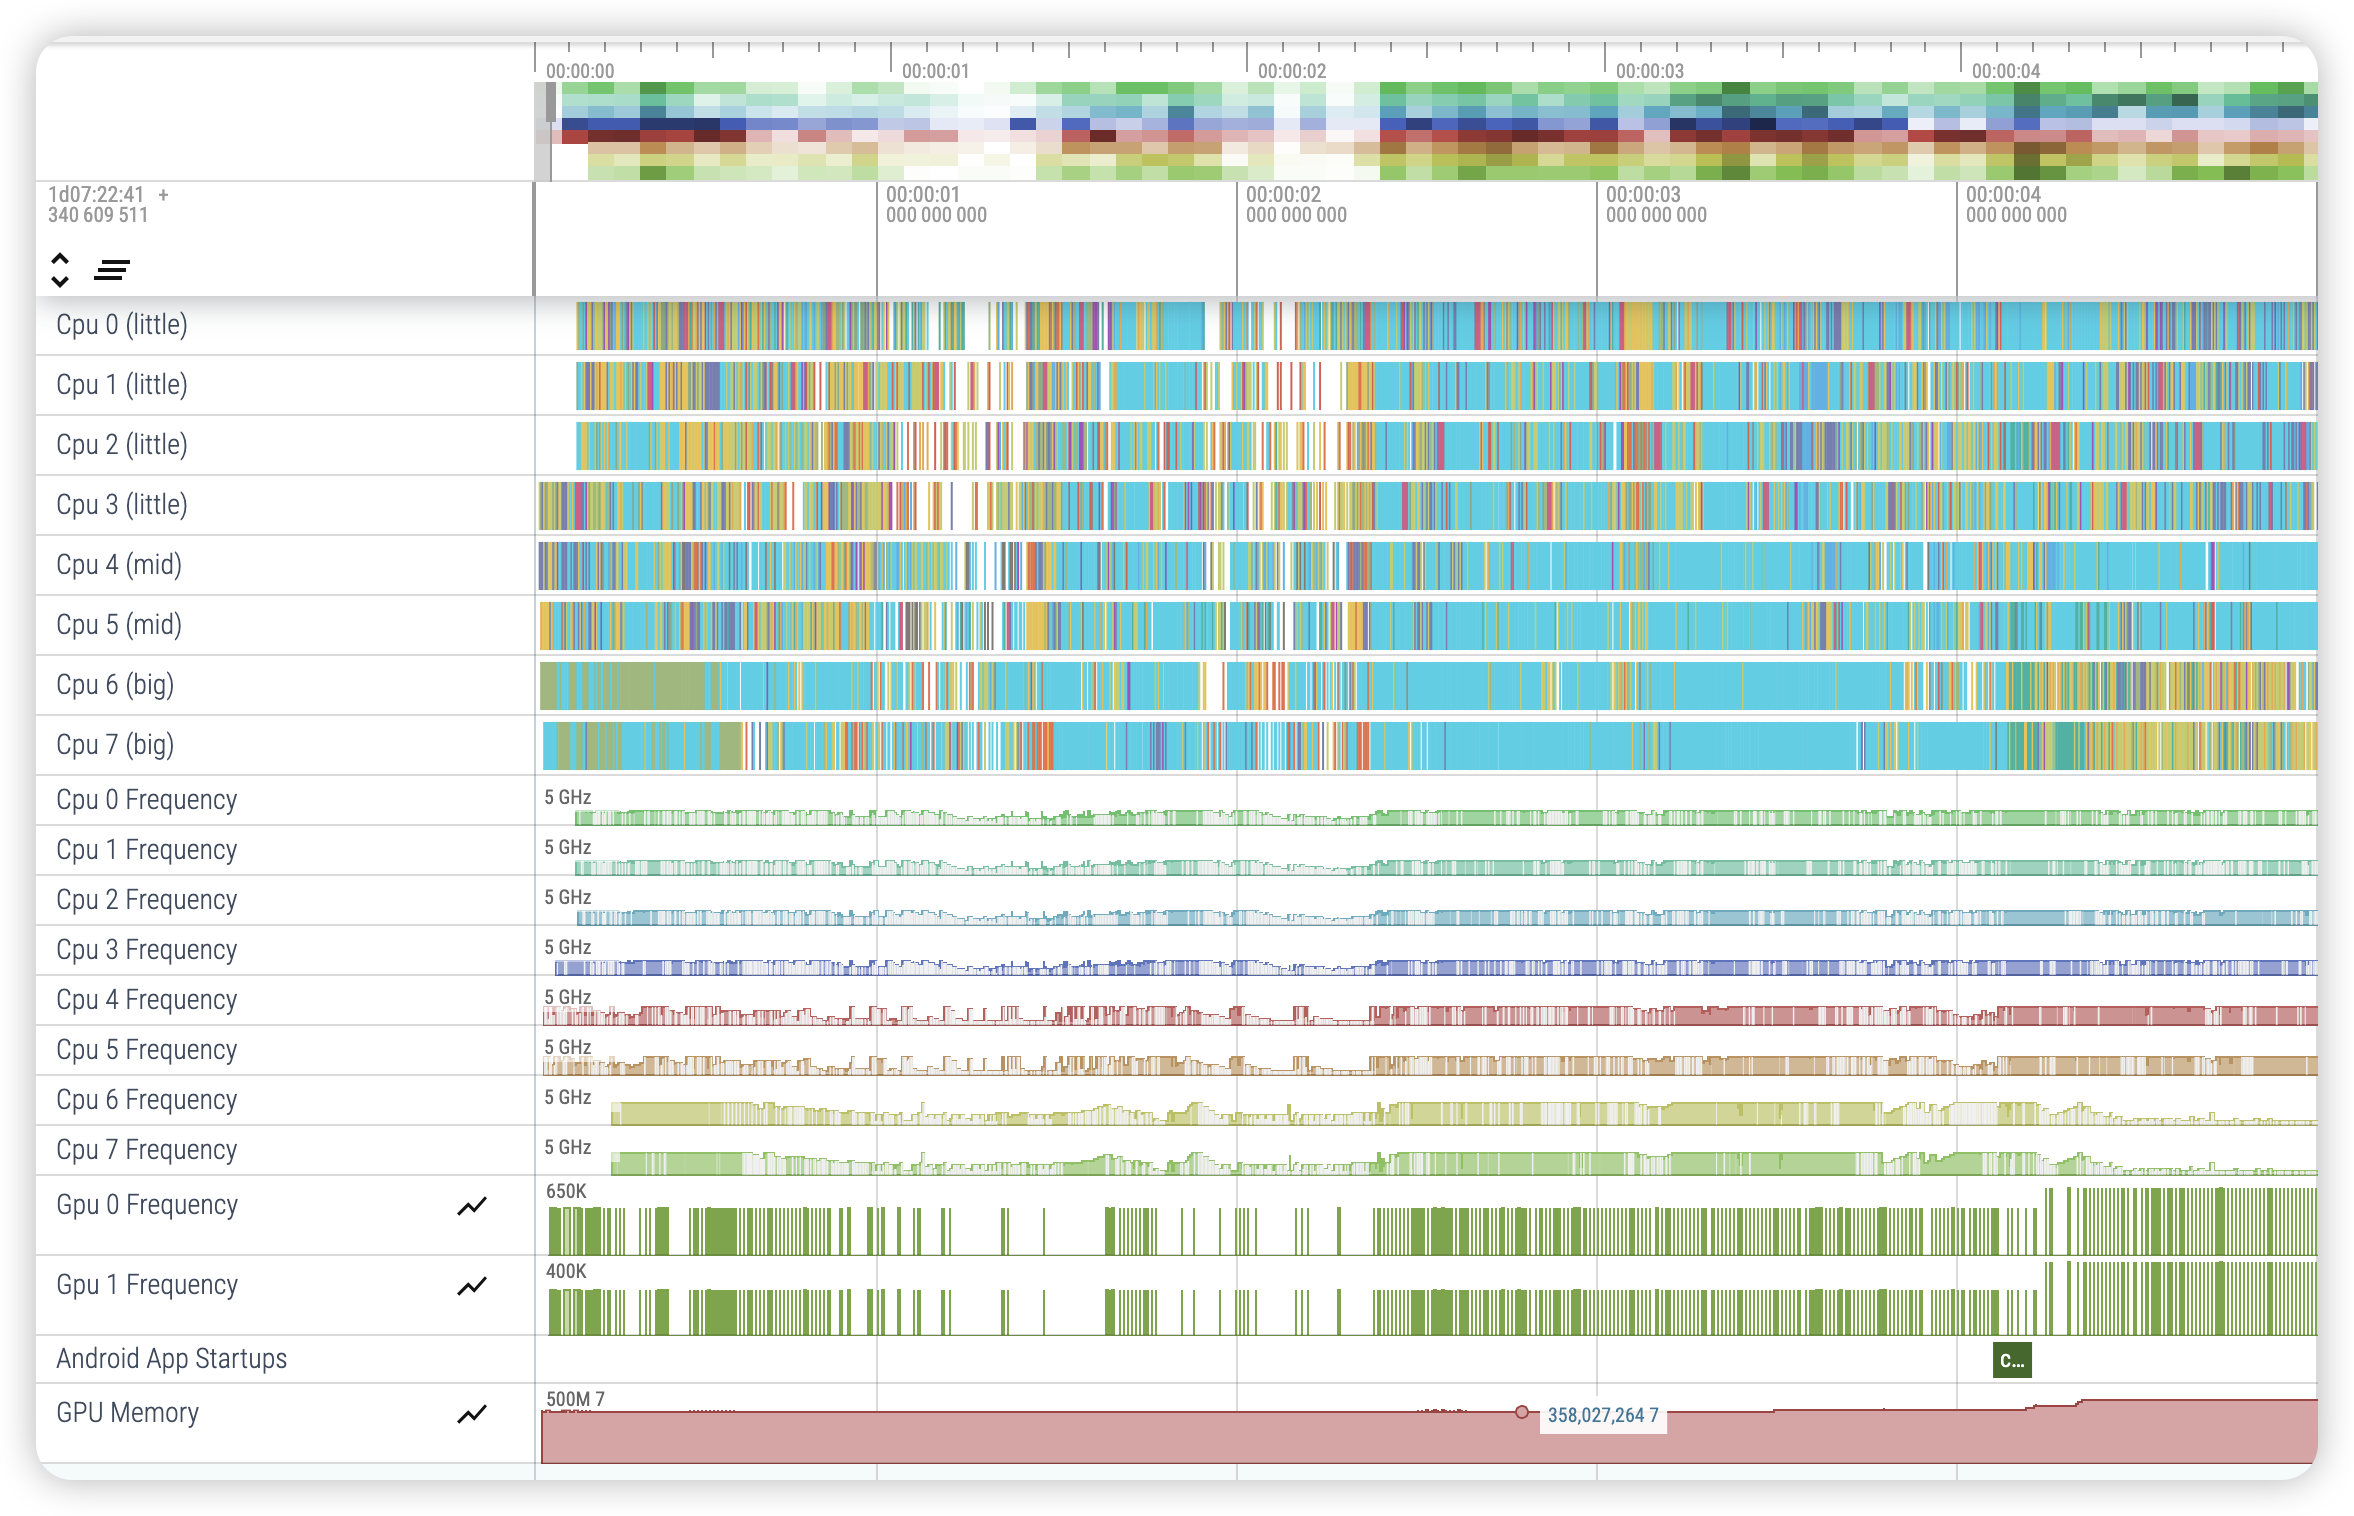
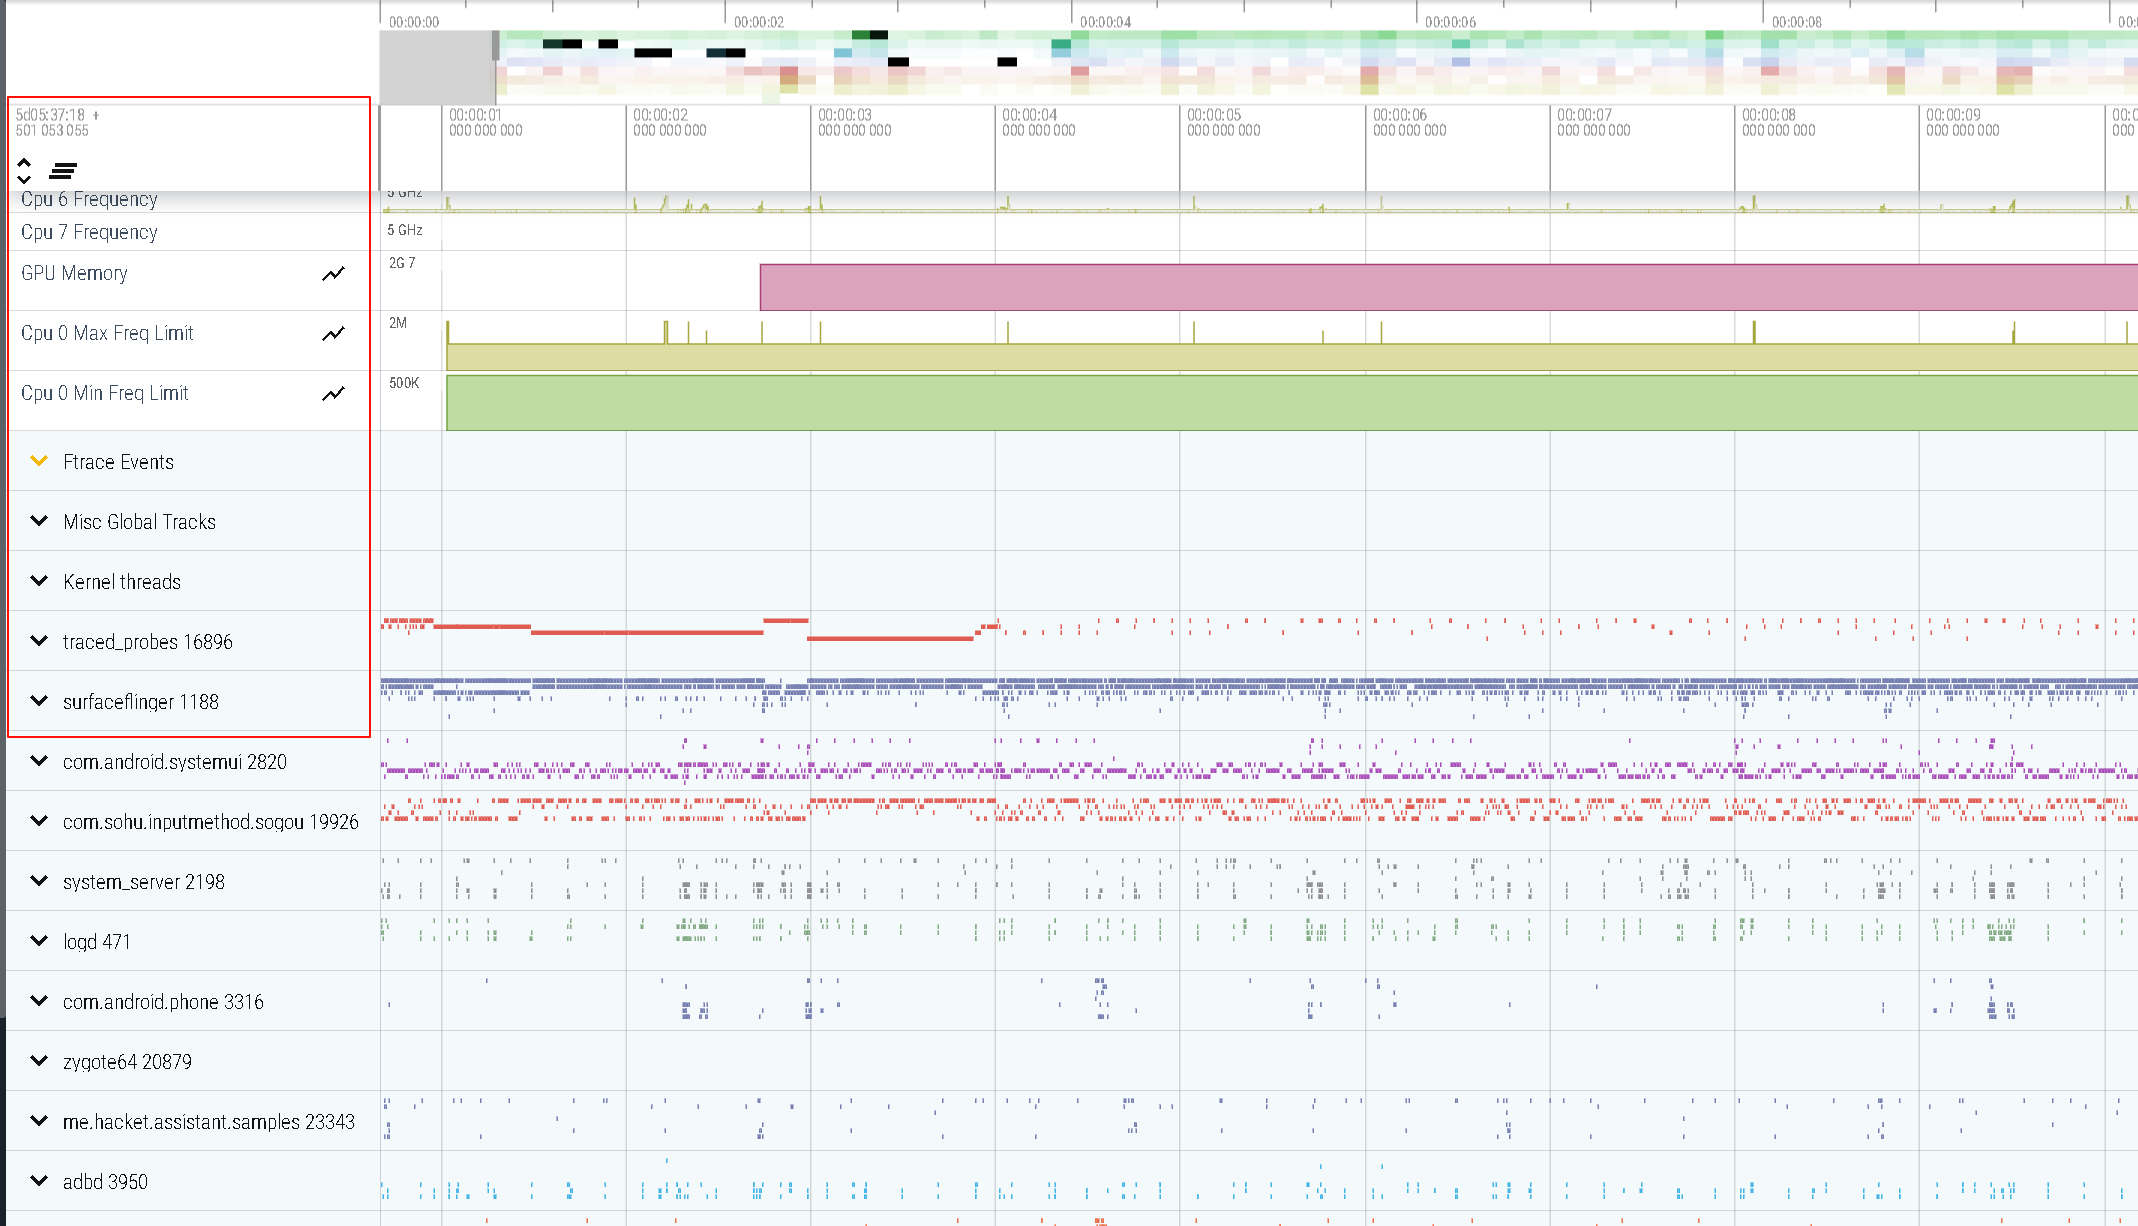
主界面
红框部分就是配置文件中自行配置的需求:
基本操作方法
快捷键
基本操作通过 "W"、"S"、"A"、"D" 实现,英文键盘下,w 可以实现对 trace 范围的放大,s 可以缩小范围,a 整体左移,d 整体右移。
或者按住 ctrl 键 + 鼠标齿轮
线程操作
- 左键单击某个线程,既可看到详细信息,例如耗时等。
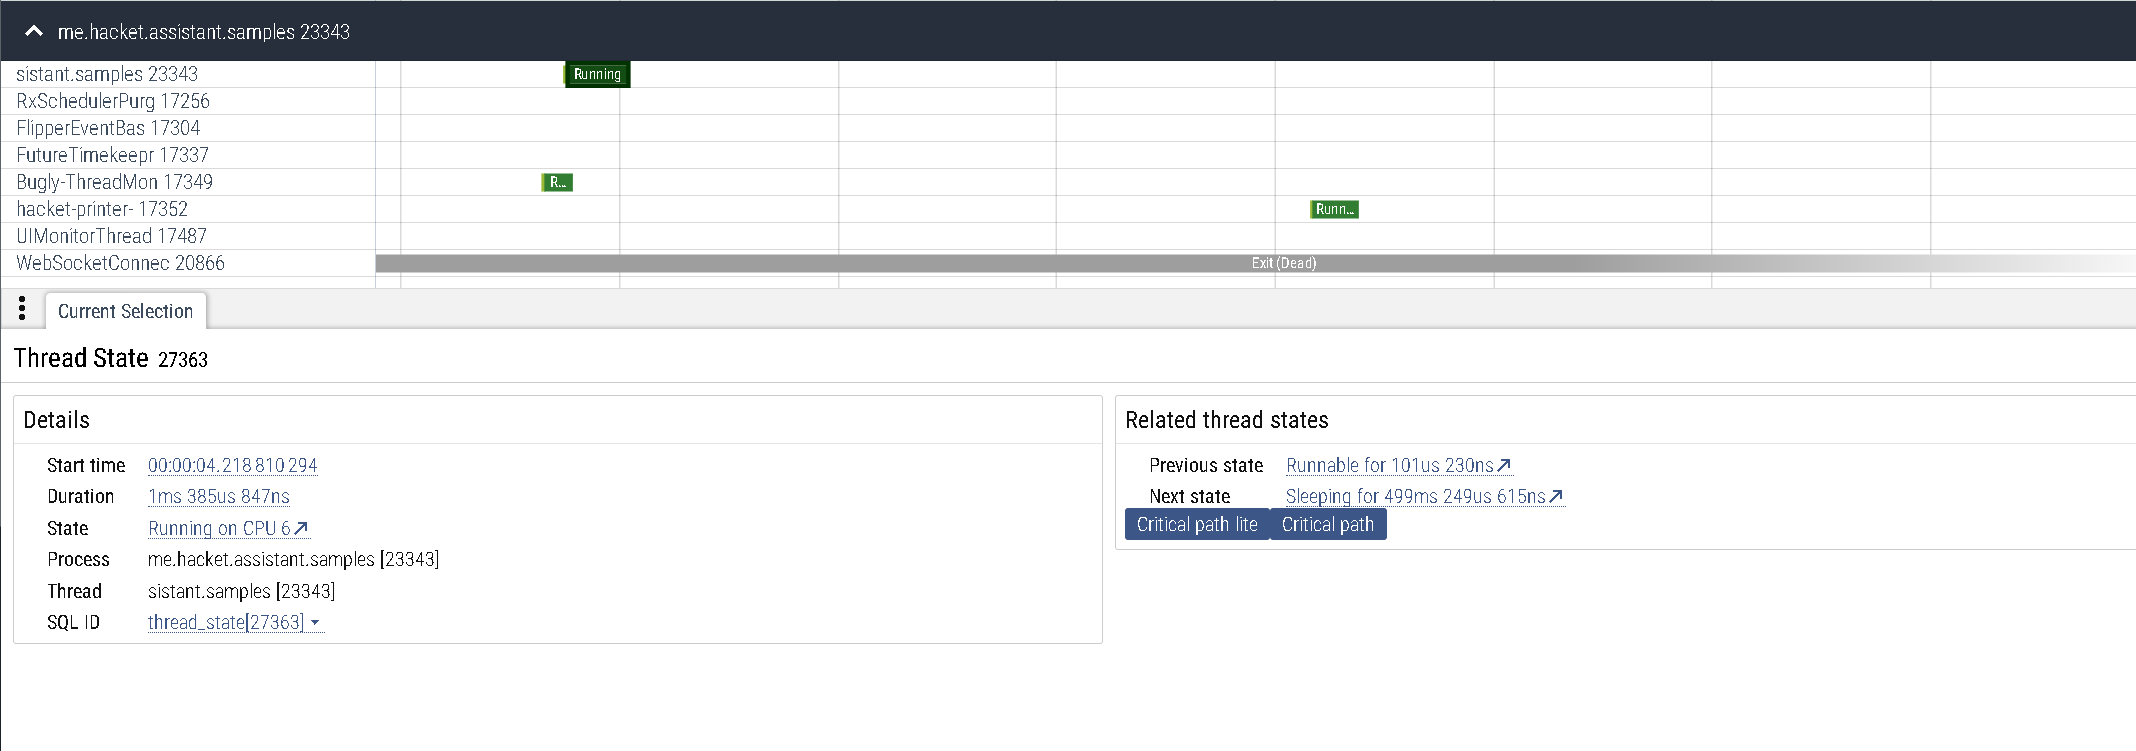
- 再
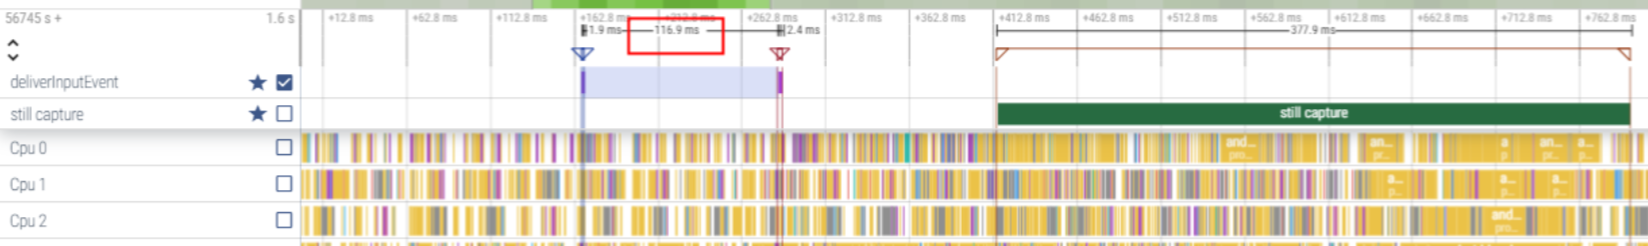
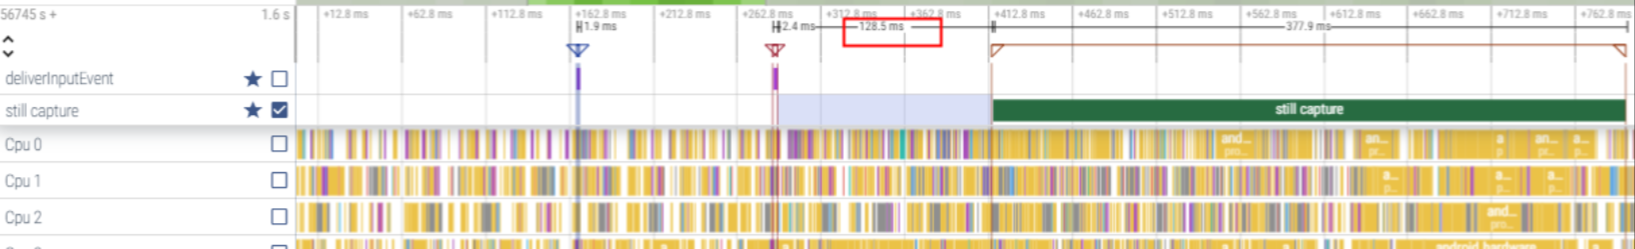
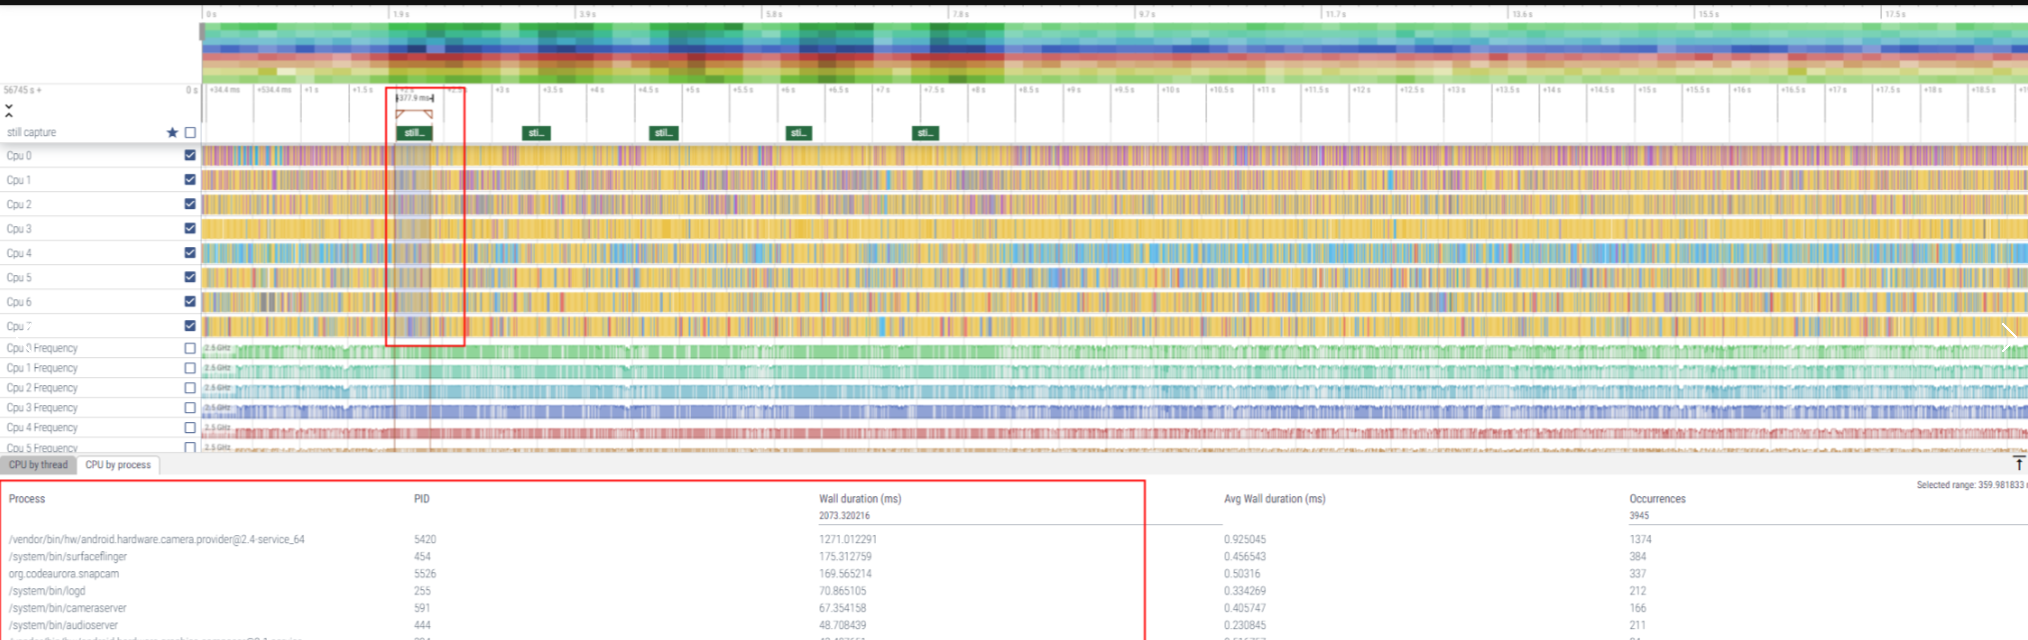
shift+M,可以精准标注该线程,使用鼠标左键长按整个区间,选择在需要分析的部分长按,既可获取在此期间的各个进程的操作,如图所示就是在still capture期间内 CPU 负载的具体情况,如果想看此时 CPU 频率,左键长按在 CPU Frequency 上既可查看期间内频率的变化。
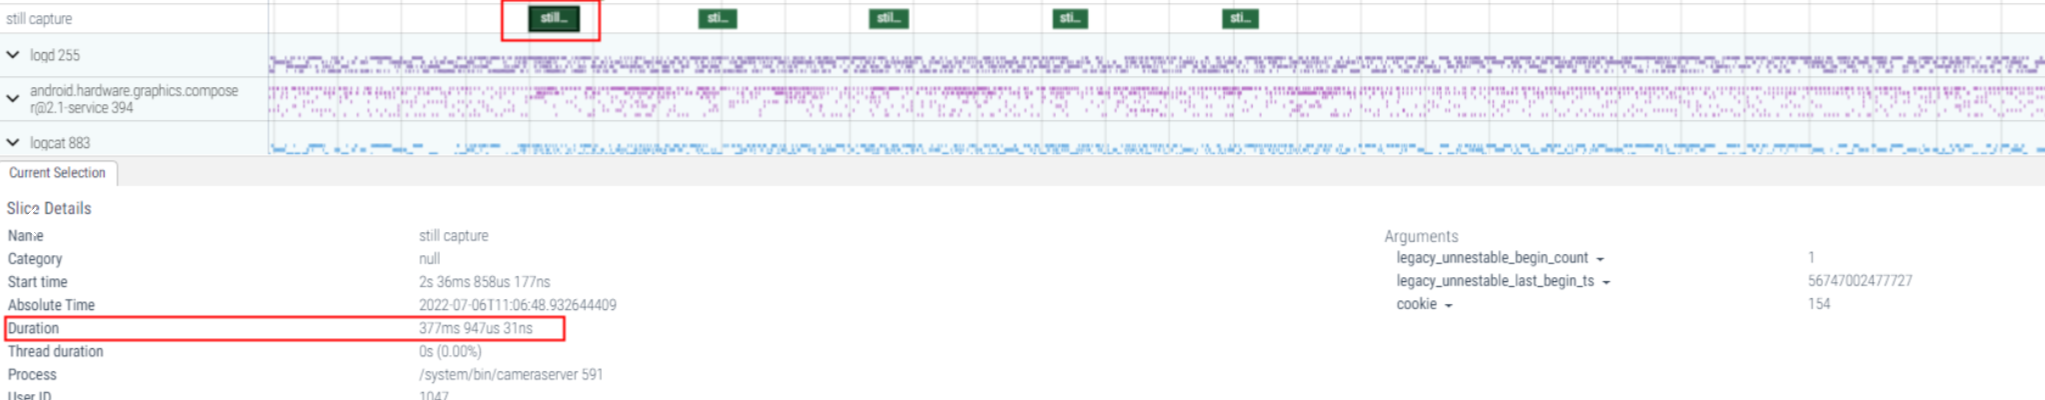
通过对每个线程进行精准标注,就可以知道每个操作之间的耗时,以点击拍照到拍照完成为例,deliverInputEvent 表示点击时触摸按下到抬起的时间,耗时在 116.9ms 左右,触摸抬起后启动拍照流程耗时 128.5ms,最后拍照完成 still capture 耗时 377.9ms。